

Ethereum Price Forecast: Weakening derivatives and US sentiment keep ETH below $2,500

Source Fxstreet

Ethereum price today: $2,490

  • Ethereum perpetuals are dominated by short positioning amid subdued open interest.
  • Nine straight days of outflows in ETH ETFs and declining US sentiment weigh on the top altcoin's price.
  • ETH retests the 50-day EMA resistance after its earlier decline.

Ethereum (ETH) saw a brief recovery on Friday, up 3% over the past 24 hours, but remains below the $2,500 key level as derivatives continue to show weakness.

Open interest, the total value of outstanding contracts in a derivatives market, briefly rose to 13.29 million ETH earlier on Thursday as prices fell, before retreating to 12.83 million ETH.
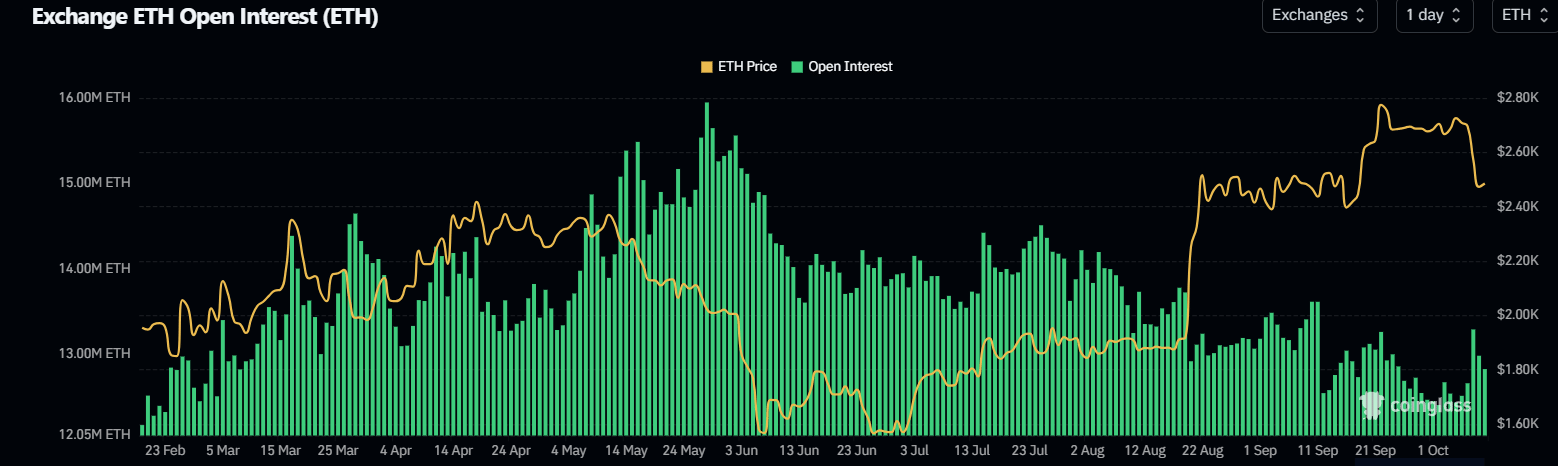
ETH Open Interest. Source: Coinglass

The brief rise and subsequent decline in OI, followed by accelerated price declines, coincides with a negative flash in funding rates, suggesting that the capital inflow was short-side positioning.

Ethereum long traders bore most of the brunt among top cryptocurrencies, with nearly $400 million in liquidations across Wednesday and Thursday, outpacing that of Bitcoin, per CryptoQuant data.

Prior to the recent decline, ETH's Net Taker Volume indicated dominant short positioning over the past month, despite price strength.

The metric measures the difference between buying and selling volume of investors executing trades using market orders in ETH perpetuals.

It has remained negative since early September, with dominance increasing over the past two days.

ETH Net Taker Volume. Source: CryptoQuant

ETH ETF outflows accelerate US selling pressure

On the spot side, recent selling pressure has largely been flowing from US markets.

US spot ETH exchange-traded funds (ETFs) recorded $56.1 million in net outflows on Thursday, marking nine consecutive days of outflows, according to SoSoValue data. The products posted over $542 million in net outflows this week, their largest since January.

The weakness across US markets is also evident in the Coinbase Premium Index, which measures the price gap between an asset trading on Coinbase Pro (in USD) and Binance (in USDT). It acts as a real-time indicator, showing whether buying or selling pressure is stronger in the US compared to international markets. After a brief rise last week, the metric plunged over the last two days, reaching -0.077.

ETH Coinbase Premium Index. Source: CryptoQuant

The global US market is also under pressure, with Brent crude prices rising and 10Y US Treasury Yields remaining elevated above 5.2%.

Ethereum technical outlook: ETH faces 50-day EMA resistance

On the daily chart, ETH is holding a neutral to slightly bearish tone as price sits above the 100-day Exponential Moving Average (EMA) near $2,344 but remains capped by the 50- and 20-day EMAs at $2,501 and $2,606.

This configuration suggests an ongoing consolidation after the recent pullback, with the 14-day Relative Strength Index (RSI) easing toward the mid-40s area and the Stochastic reading 23, hinting at waning bullish momentum without yet signaling oversold conditions.

On the topside, immediate resistance is found at the 50-day EMA, followed by a horizontal barrier near $2,548 and the 20-day EMA. Above that, further resistance aligns around $2,637 and then $2,782 before higher hurdles at roughly $3,076 and $3,253.

Chart Analysis ETH/USDT (Binance)
ETH/USDT daily chart

On the downside, initial support appears at the horizontal level near $2,355, with additional layers lower at about $2,205, $1,972 and $1,828, where a deeper correction could find stronger dip-buying interest.

(The technical analysis of this story was written with the help of an AI tool. Know more.)

Disclaimer: For information purposes only. Past performance is not indicative of future results.
placeholder
Gold holds steady below $4,150 amid elevated US yields Gold price (XAU/USD) trades on a flat note near $4,140 during the early Asian session on Tuesday. Pressure from a stronger US Dollar (USD) and elevated US Treasury yields was offset by reduced expectations of a Federal Reserve (Fed) rate hike this month.
Author  FXStreet
Oct 06, Tue
Gold price (XAU/USD) trades on a flat note near $4,140 during the early Asian session on Tuesday. Pressure from a stronger US Dollar (USD) and elevated US Treasury yields was offset by reduced expectations of a Federal Reserve (Fed) rate hike this month.
placeholder
【Daily Brief】Gold rebounds 1% off a two-month low, Nasdaq drops 1.25% and yields ease — the storm premium keeps WTI near $91Gold trades at $4,174 after rebounding from Wednesday's $4,090 two-month low, the Nasdaq fell 1.25% while the Dow edged higher, and the 10-year Treasury eased to 5.23% from the week's highs. Hurricane Isaias keeps about 25% of Gulf output shut in with WTI near $91, and bitcoin holds below $82,000. The next scheduled tests are the EIA report on 15 October and the FOMC on 27-28 October.
Author  Irene Q.
Yesterday 06: 28
Gold trades at $4,174 after rebounding from Wednesday's $4,090 two-month low, the Nasdaq fell 1.25% while the Dow edged higher, and the 10-year Treasury eased to 5.23% from the week's highs. Hurricane Isaias keeps about 25% of Gulf output shut in with WTI near $91, and bitcoin holds below $82,000. The next scheduled tests are the EIA report on 15 October and the FOMC on 27-28 October.
placeholder
Hurricane Isaias has shut in a quarter of Gulf oil output — can WTI clear $92 before Thursday's EIA report?WTI trades at $90.80 after rebounding roughly 3% from Wednesday's $87.96 low as Hurricane Isaias — the Atlantic season's first — forces producers to shut in about 25% of US Gulf of Mexico output. Brent holds at $103.41. The first official read on the disruption arrives with the EIA weekly petroleum report on Thursday 15 October — here are the key levels and both scenarios.
Author  Irene Q.
Yesterday 06: 38
WTI trades at $90.80 after rebounding roughly 3% from Wednesday's $87.96 low as Hurricane Isaias — the Atlantic season's first — forces producers to shut in about 25% of US Gulf of Mexico output. Brent holds at $103.41. The first official read on the disruption arrives with the EIA weekly petroleum report on Thursday 15 October — here are the key levels and both scenarios.
placeholder
US September CPI preview: inflation set to hit 3.7% — will the Fed hike in December?US September CPI lands Wednesday with headline inflation seen at 3.7% y/y and core at 0.2% m/m. December hike odds sit near 70% — here are the scenarios, the calendar and the key levels.
Author  Irene Q.
11 hours ago
US September CPI lands Wednesday with headline inflation seen at 3.7% y/y and core at 0.2% m/m. December hike odds sit near 70% — here are the scenarios, the calendar and the key levels.
placeholder
Gold posts first weekly gain in three weeks — can $4,200 hold through CPI?Spot gold closed at $4,194.645, up 1.47% — its first weekly gain in three weeks — and COMEX futures settled back above $4,200 at $4,220.30. Here are the drivers, the levels and the scenarios into Wednesday's CPI.
Author  Irene Q.
9 hours ago
Spot gold closed at $4,194.645, up 1.47% — its first weekly gain in three weeks — and COMEX futures settled back above $4,200 at $4,220.30. Here are the drivers, the levels and the scenarios into Wednesday's CPI.
Related Instrument
goTop
quote