

Dogecoin Price Forecast: Whale selling and bearish momentum threaten further correction

Source Fxstreet
  • Dogecoin nears the previously broken ascending trendline on Friday after losing over 11% so far this week.
  • Santiment data shows certain whales offloading DOGE tokens, adding to the near-term selling pressure.
  • The technical outlook suggests further losses as momentum indicators turn bearish.

Dogecoin (DOGE) approaches the previously broken ascending trendline on Friday after double-digit losses so far this week. The bearish pressure is intensifying as some whales offload DOGE tokens. Meanwhile, weakening technical momentum indicators suggest further correction in the meme coin.

Some whales offloading tokens

Santiment’s Supply Distribution data supports a bearish outlook for Dogecoin, as some large-wallet holders (whales) are reducing exposure.

The metric indicates that whales holding between 1 million and 10 million (yellow line) and 10 million and 100 million tokens (blue line) have shed 100 million tokens since Tuesday. This indicates some whales are reducing exposure, signaling potential profit-booking activity and adding to near-term downside risks for the dog-themed meme coin.

Dogecoin supply distribution metrics chart. Source: Santiment

CryptoQuant’s summary data also shows a bearish outlook for the dog-themed meme coin. DOGE’s spot and futures markets show overheating conditions, while the futures market shows large whale orders but with sell-side dominance. This highlights a bearish, cautious sentiment bias among meme coin traders.
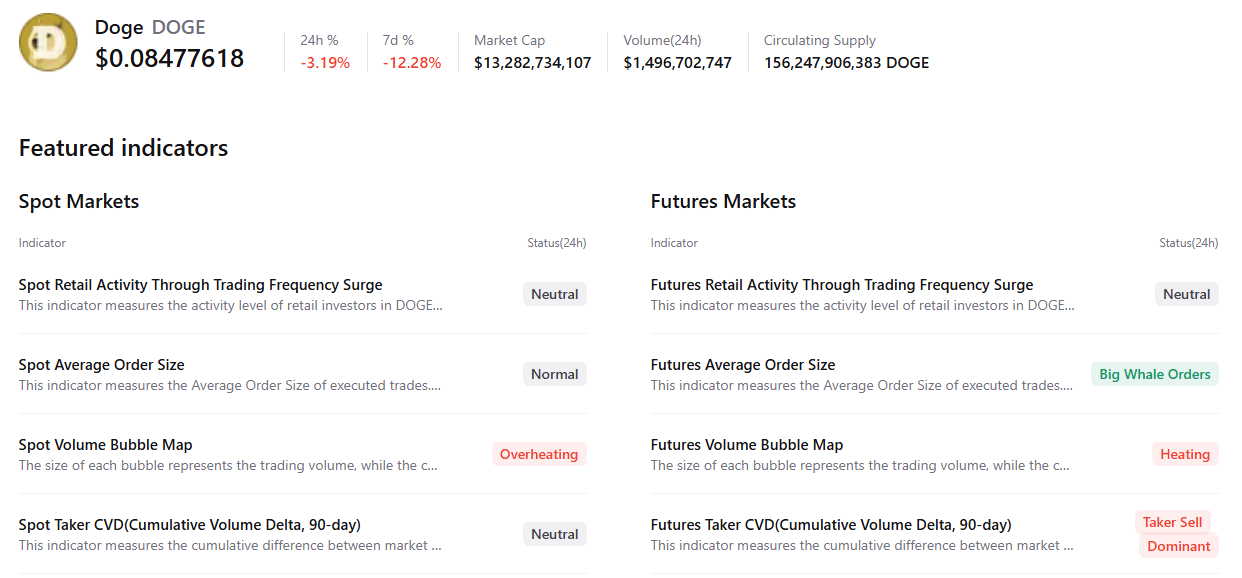
Dogecoin summary chart. Source: CryptoQuant

Some signs of optimism

Despite the price drop, Dogecoin derivatives show some signs of optimism. CoinGlass’ long-to-short ratio for DOGE reads 1.18 on Friday, nearing the highest level over a month. A ratio being above one indicates bullish sentiment, as traders bet that asset prices will rise.
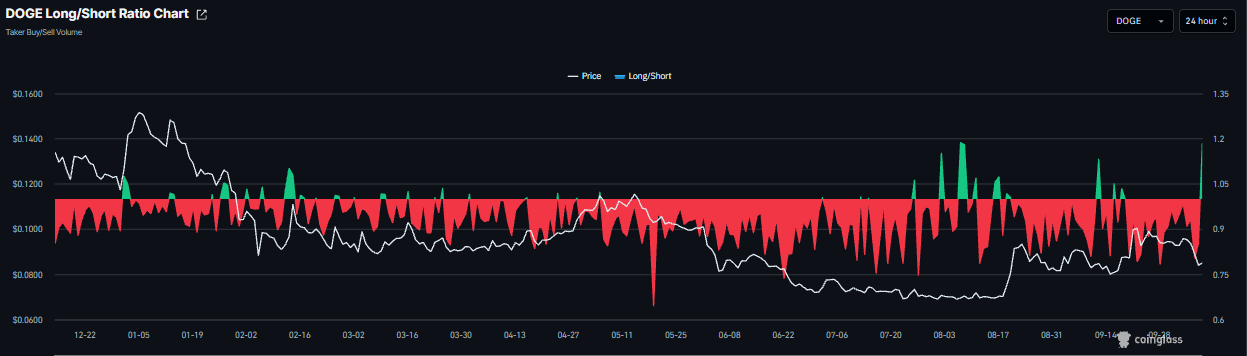
Dogecoin long-to-short ratio chart. Source: Coinglass

In addition, DOGE funding rates flipped positive on September 9 and remain constructive, reading 0.0010% on Friday, indicating longs are paying shorts and signaling bullish sentiment.
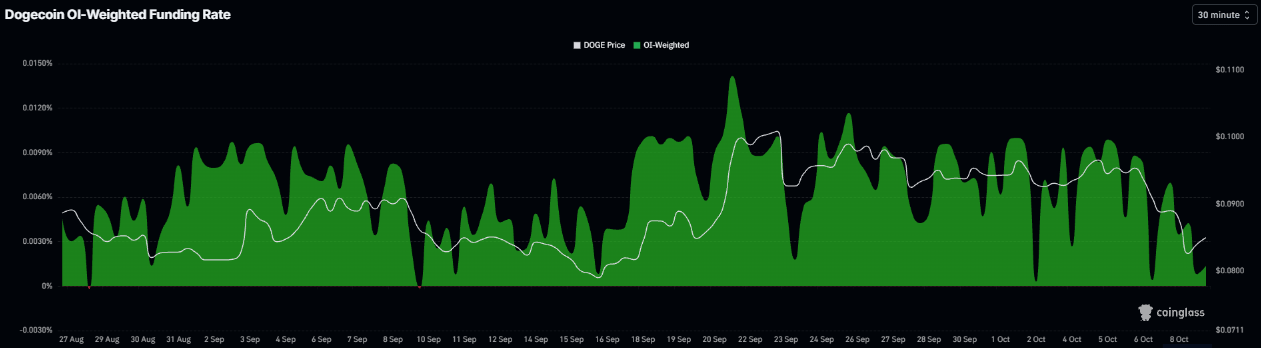
Dogecoin funding rates chart. Source: Coinglass

Dogecoin technical outlook: Bearish momentum indicators

Dogecoin price trades at $0.085 on Friday after falling over 11% so far this week. DOGE holds just above the broken upward trendline support at $0.084 but remains capped by a dense band of Exponential Moving Averages overhead, keeping the near-term bias bearish. 

The 100-day EMA at $0.086 is the first ceiling, followed closely by the 50-day EMA at $0.088 and the horizontal barrier around $0.088, while the 200-day EMA higher at $0.093 reinforces the idea of rallies being constrained. 

Momentum indicators echo this soft tone, with the Relative Strength Index (RSI) hovering near a neutral-to-weak 40 and the Moving Average Convergence Divergence (MACD) line below zero and its signal, with a negative, slightly expanding histogram that suggests sellers retain the upper hand.

On the downside, immediate support is seen at the reclaimed trendline area around $0.084; a daily close below this level would expose the next structural floors at $0.078 and $0.070. 

On the topside, bulls would need to clear the EMA cluster starting at $0.086 and $0.088 to ease bearish pressure, with a more meaningful shift likely only if price extends toward and overcomes the 200-day EMA at $0.093 and, later, the major resistance at $0.102.
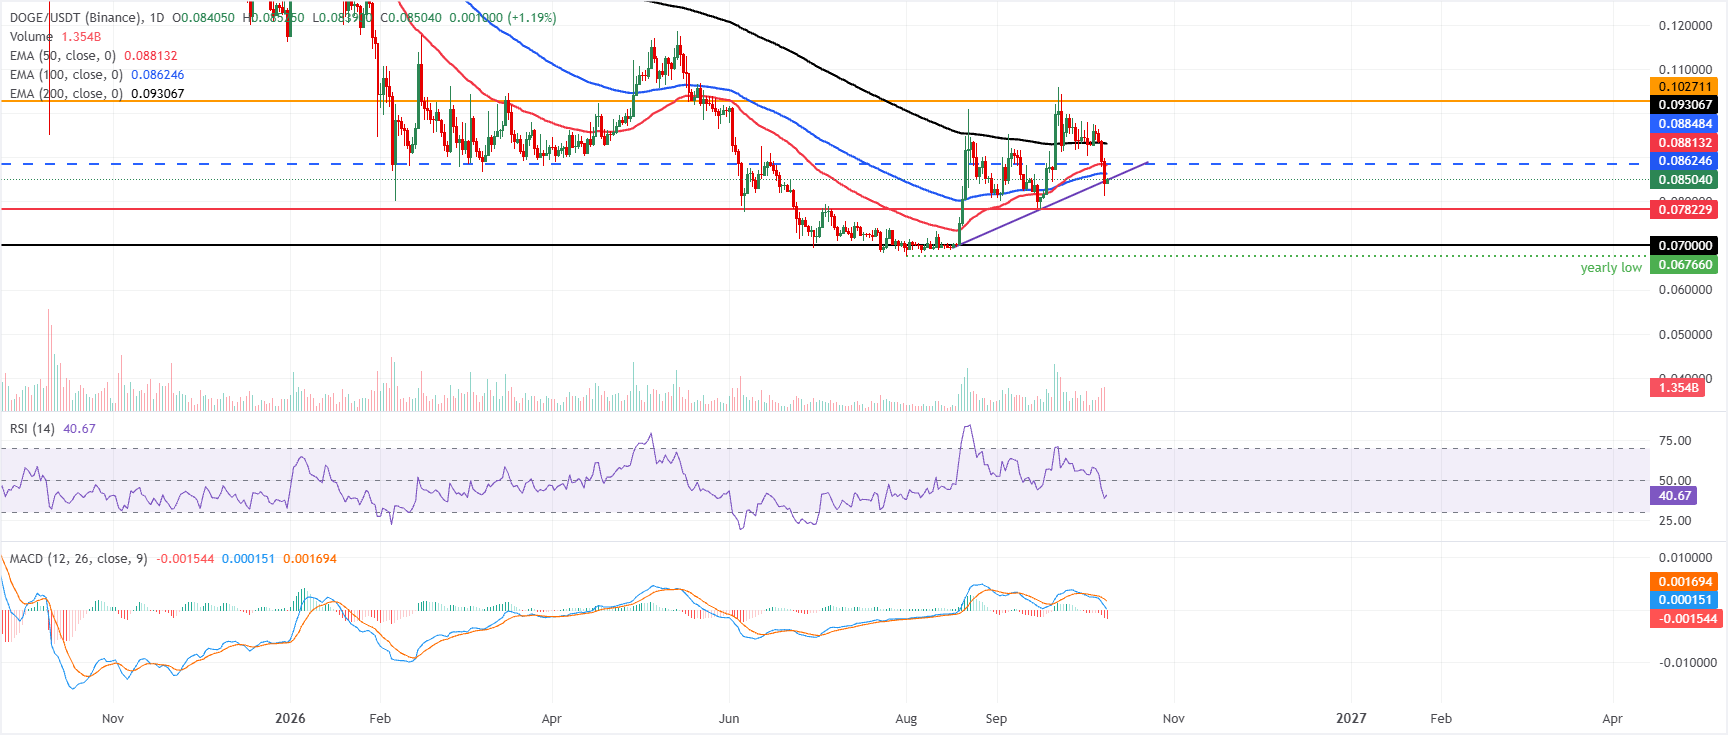
DOGE/USDT daily chart

(The technical analysis of this story was written with the help of an AI tool. Know more.)

Disclaimer: For information purposes only. Past performance is not indicative of future results.
placeholder
Gold posts first weekly gain in three weeks — can $4,200 hold through CPI?Spot gold closed at $4,194.645, up 1.47% — its first weekly gain in three weeks — and COMEX futures settled back above $4,200 at $4,220.30. Here are the drivers, the levels and the scenarios into Wednesday's CPI.
Author  Irene Q.
10 hours ago
Spot gold closed at $4,194.645, up 1.47% — its first weekly gain in three weeks — and COMEX futures settled back above $4,200 at $4,220.30. Here are the drivers, the levels and the scenarios into Wednesday's CPI.
placeholder
US September CPI preview: inflation set to hit 3.7% — will the Fed hike in December?US September CPI lands Wednesday with headline inflation seen at 3.7% y/y and core at 0.2% m/m. December hike odds sit near 70% — here are the scenarios, the calendar and the key levels.
Author  Irene Q.
12 hours ago
US September CPI lands Wednesday with headline inflation seen at 3.7% y/y and core at 0.2% m/m. December hike odds sit near 70% — here are the scenarios, the calendar and the key levels.
placeholder
Gold Price Forecast: Gold Rebounds Above $4,200, Can Falling Oil Prices Drive Another Rally?As of Friday (October 9), gold prices (XAUUSD) rebounded noticeably after consecutive declines. During today's Asian session, gold prices briefly rebounded above $4,200, reaching an intra
Author  TradingKey
Yesterday 09: 23
As of Friday (October 9), gold prices (XAUUSD) rebounded noticeably after consecutive declines. During today's Asian session, gold prices briefly rebounded above $4,200, reaching an intra
placeholder
Hurricane Isaias has shut in a quarter of Gulf oil output — can WTI clear $92 before Thursday's EIA report?WTI trades at $90.80 after rebounding roughly 3% from Wednesday's $87.96 low as Hurricane Isaias — the Atlantic season's first — forces producers to shut in about 25% of US Gulf of Mexico output. Brent holds at $103.41. The first official read on the disruption arrives with the EIA weekly petroleum report on Thursday 15 October — here are the key levels and both scenarios.
Author  Irene Q.
Yesterday 06: 38
WTI trades at $90.80 after rebounding roughly 3% from Wednesday's $87.96 low as Hurricane Isaias — the Atlantic season's first — forces producers to shut in about 25% of US Gulf of Mexico output. Brent holds at $103.41. The first official read on the disruption arrives with the EIA weekly petroleum report on Thursday 15 October — here are the key levels and both scenarios.
placeholder
【Daily Brief】Gold rebounds 1% off a two-month low, Nasdaq drops 1.25% and yields ease — the storm premium keeps WTI near $91Gold trades at $4,174 after rebounding from Wednesday's $4,090 two-month low, the Nasdaq fell 1.25% while the Dow edged higher, and the 10-year Treasury eased to 5.23% from the week's highs. Hurricane Isaias keeps about 25% of Gulf output shut in with WTI near $91, and bitcoin holds below $82,000. The next scheduled tests are the EIA report on 15 October and the FOMC on 27-28 October.
Author  Irene Q.
Yesterday 06: 28
Gold trades at $4,174 after rebounding from Wednesday's $4,090 two-month low, the Nasdaq fell 1.25% while the Dow edged higher, and the 10-year Treasury eased to 5.23% from the week's highs. Hurricane Isaias keeps about 25% of Gulf output shut in with WTI near $91, and bitcoin holds below $82,000. The next scheduled tests are the EIA report on 15 October and the FOMC on 27-28 October.
Related Instrument
goTop
quote