Top 3 Price Prediction Bitcoin, Ethereum, Ripple: Bitcoin approaches its $56,000 support level

Quelle Fxstreet
  • Bitcoin nears the key daily support level of $56,000, eyeing for a recovery.
  • Ethereum price faces resistance at $2,461, suggesting a downward trend and weak momentum.
  • Ripple price retested and bounced above the 100-day EMA at $0.553, signaling a continuation of an upward trend.


Bitcoin (BTC) is approaching a crucial daily support level of $56,000, hinting at a possible recovery. At the same time, Ethereum (ETH) faced rejection from the resistance level, suggesting a downward trend with weak momentum. In contrast, Ripple (XRP) has bounced above the 100-day EMA, indicating a continued upward trend.


Bitcoin could bounce off support at $56,000 for a recovery

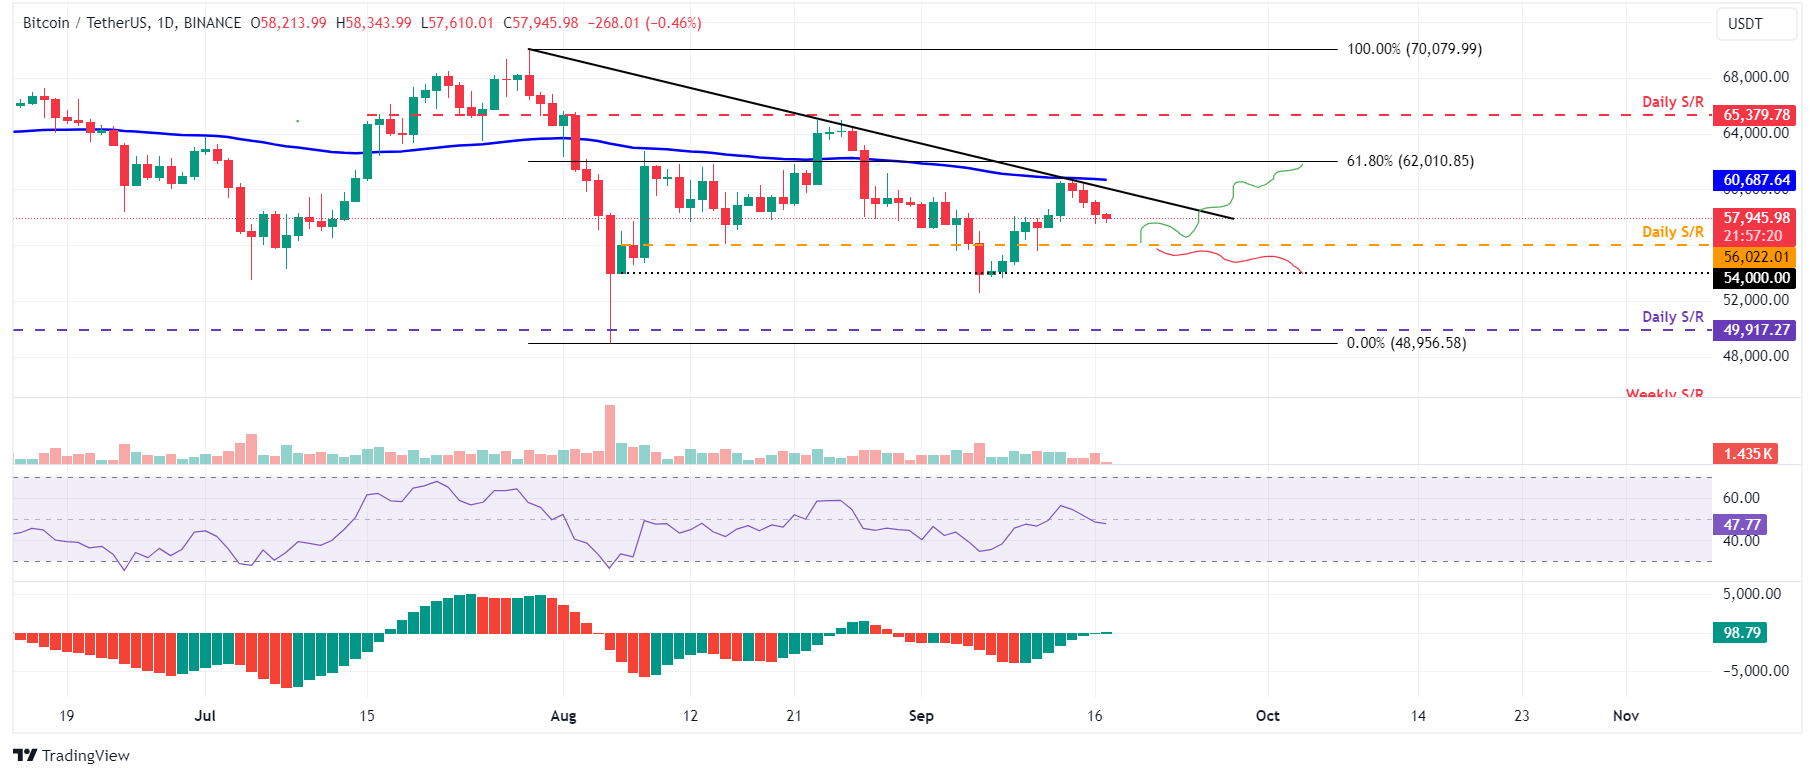
Bitcoin price failed to close above the 100-day Exponential Moving Average (EMA) at $60,685 and the descending trendline (drawn from multiple high levels from the end of July) on Friday.

It declined 3.78% in the next three days. At the time of writing on Tuesday, it continues to retrace down to $57,851.

If BTC continues to retrace down, it could find support around the daily level of $56,022. If this support holds, it could again attempt to break above the 100-day Exponential Moving Average (EMA) at $60,685 and the descending trendline.

The Relative Strength Index (RSI) and the Awesome Oscillator (AO) on the daily chart hover around their neutral levels of 50 and zero, indicating that neither the bulls nor the bears control the momentum. For the aforementioned bullish move to be sustained, both indicators must trade above their neutral levels.
BTC/USDT daily chart

BTC/USDT daily chart

However, If BTC closes below the $56,022 daily support level, the bullish thesis will be invalidated. In this case, it could decline 3.6% to retest its psychologically important level at $54,000.


Ethereum shows signs of weakness 

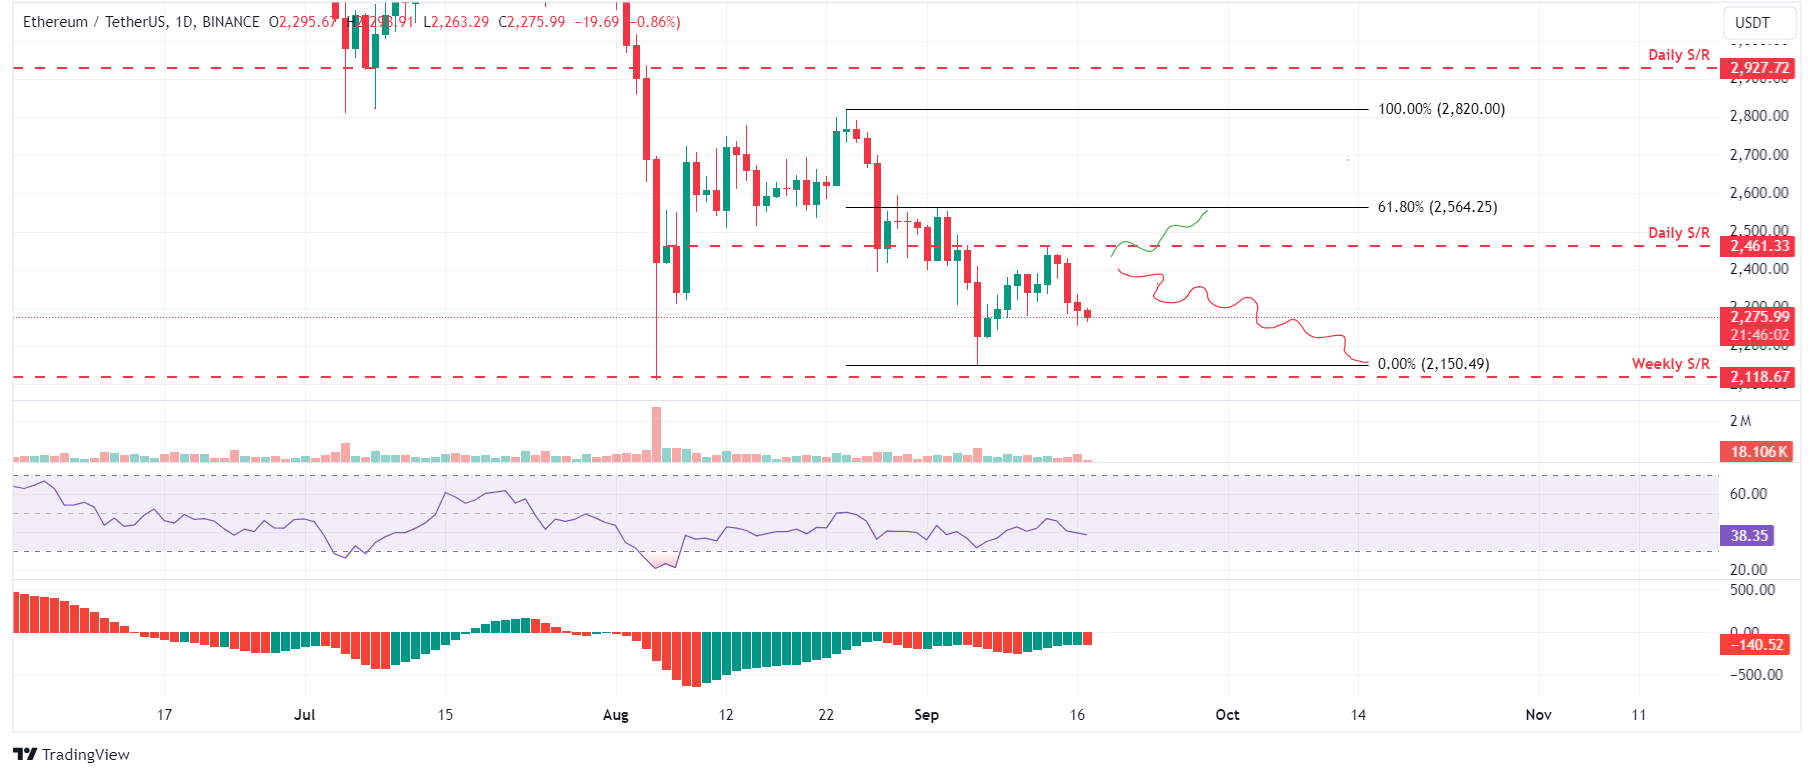
Ethereum price failed to close above the daily resistance level of $2,461 on Friday and declined 5.88% over the next three days. As of Tuesday, it continues to decline and trades at $2,275.

If $2,461 continues to hold as resistance, ETH could decline further by 5.6% from its current trading level to retest its September 6 low of $2,150.

The RSI and the AO on the daily chart trades below their neutral levels of 50 and zero. Both momentum indicators suggest the continuation of a bearish momentum.
ETH/USDT daily chart

ETH/USDT daily chart

However, the bearish thesis would be invalidated if ETH breaks and closes above the $2,461 resistance level. In such a scenario, ETH could rally 4% to retest its 61.8% Fibonacci retracement level at $2,564.


Ripple is poised for a rally after finding support around 100-day EMA 

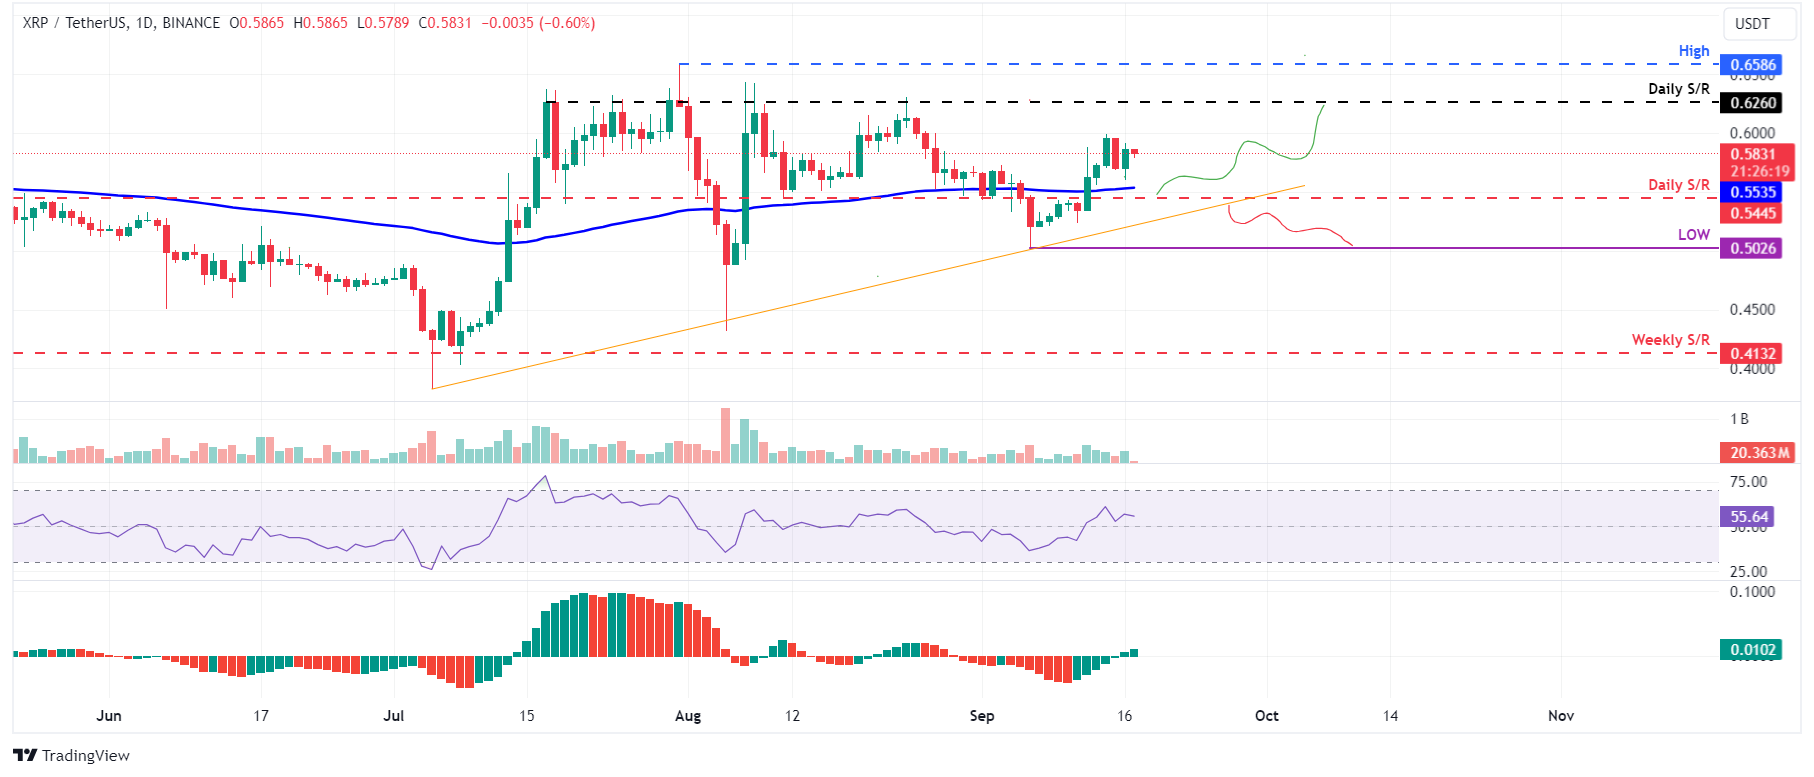
Ripple price broke and closed above the daily resistance level at $0.544 and the 100-day EMA at $0.553 on September 12. It rallied 6% the next two days, retraced and found support around the 100-day EMA at $0.533 on Monday. When writing on Tuesday, it trades above at $0.583.

If the 100-day EMA at $0.553 and the daily support at $0.544 continue to hold as support, XRP could continue its upward trend to retest its daily resistance level at $0.626.

The RSI and the AO on the daily chart trades above their neutral level of 50 and zero, respectively. Both indicators show that the bulls are in control, and the bullish momentum continues. 
XRP/USDT daily chart

XRP/USDT daily chart

However, the bullish outlook would be invalidated if XRP’s daily candlestick closes below the $0.544 daily support level and breaks below the ascending trendline. In such a case, XRP would decline 7.5% to retest its September 6 low of $0.502.

Haftungsausschluss: Nur zu Informationszwecken. Die bisherige Performance ist kein verlässlicher Indikator für zukünftige Ergebnisse.
placeholder
Japanischer Yen dümpelt nahe einem Mehrmonatstief gegenüber dem USD aufgrund von Unsicherheiten der BoJDer japanische Yen (JPY) kämpft weiterhin darum, während der asiatischen Sitzung am Mittwoch nennenswerte Käufer anzuziehen, und verharrt in der Nähe des tiefsten Standes seit dem 13. Februar, der am Vortag gegenüber seinem amerikanischen Pendant erreicht wurde.
Autor  FXStreet
Mi. 12.Nov
Der japanische Yen (JPY) kämpft weiterhin darum, während der asiatischen Sitzung am Mittwoch nennenswerte Käufer anzuziehen, und verharrt in der Nähe des tiefsten Standes seit dem 13. Februar, der am Vortag gegenüber seinem amerikanischen Pendant erreicht wurde.
placeholder
Goldpreis-Prognose: XAU/USD klettert zurück über 4.200 US-Dollar – schwächerer USD und Risk-Off-Stimmung stützen, Fed bremst die FantasieGold (XAU/USD) steigt am Freitag in der Asiensitzung wieder über 4.200 US-Dollar, gestützt von einem schwächeren US-Dollar, wachsender Risikoaversion und Erwartungen weiterer Fed-Lockerungsschritte, während vorsichtige Aussagen von Notenbankern und klar definierte Unterstützungsmarken um 4.145/4.100 und 4.000 US-Dollar den Rahmen für die nächsten Bewegungen vorgeben.
Autor  Mitrade Team
Gestern 05: 42
Gold (XAU/USD) steigt am Freitag in der Asiensitzung wieder über 4.200 US-Dollar, gestützt von einem schwächeren US-Dollar, wachsender Risikoaversion und Erwartungen weiterer Fed-Lockerungsschritte, während vorsichtige Aussagen von Notenbankern und klar definierte Unterstützungsmarken um 4.145/4.100 und 4.000 US-Dollar den Rahmen für die nächsten Bewegungen vorgeben.
placeholder
Krypto-Markt sucht Halt: Bitcoin rutscht unter 100.000 Dollar – Ethereum und XRP verlieren SchlüsselmarkenBitcoin fällt im Zuge einer Marktbereinigung klar unter 100.000 US-Dollar, während Ethereum und XRP an zentralen technischen Marken scheitern und wichtige Unterstützungszonen testen. Die Analyse ordnet die Kursbewegungen von BTC, ETH und XRP ein, beleuchtet das Verhalten der Marktteilnehmer und zeigt, welche Niveaus jetzt über den weiteren Verlauf der Korrektur entscheiden.
Autor  Mitrade Team
vor 23 Stunden
Bitcoin fällt im Zuge einer Marktbereinigung klar unter 100.000 US-Dollar, während Ethereum und XRP an zentralen technischen Marken scheitern und wichtige Unterstützungszonen testen. Die Analyse ordnet die Kursbewegungen von BTC, ETH und XRP ein, beleuchtet das Verhalten der Marktteilnehmer und zeigt, welche Niveaus jetzt über den weiteren Verlauf der Korrektur entscheiden.
placeholder
Canarys XRP-ETF XRPC feiert Rekordstart: Höchstes Tagesvolumen und starke ZuflüsseCanarys Spot-XRP-ETF XRPC startet mit einem Rekordvolumen von 58,5 Mio. US-Dollar und Nettozuflüssen von 245 Mio. US-Dollar und übertrifft damit alle ETF-Neulistungen des Jahres 2025. Die Analyse ordnet den Erfolg des Fonds ein, beleuchtet die nächste Welle geplanter XRP-ETFs und erklärt, warum der XRP-Kurs trotz starker Nachfrage um 4 % nachgab.
Autor  Mitrade Team
vor 23 Stunden
Canarys Spot-XRP-ETF XRPC startet mit einem Rekordvolumen von 58,5 Mio. US-Dollar und Nettozuflüssen von 245 Mio. US-Dollar und übertrifft damit alle ETF-Neulistungen des Jahres 2025. Die Analyse ordnet den Erfolg des Fonds ein, beleuchtet die nächste Welle geplanter XRP-ETFs und erklärt, warum der XRP-Kurs trotz starker Nachfrage um 4 % nachgab.
placeholder
Solana-Kursprognose: SOL fällt auf Fünf-Monats-Tief, während ETF-Zuflüsse und Stimmung nachlassenSolana fällt unter 150 US-Dollar auf ein Fünf-Monats-Tief, während US-Spot-ETFs die bislang niedrigsten Nettozuflüsse und der Derivatemarkt rückläufiges Open Interest sowie negative Funding-Rates zeigen. Die Analyse erläutert, warum ETF- und Futures-Daten auf anhaltenden Druck hinweisen, welche Unterstützungszonen bei 126 und 100 US-Dollar jetzt im Fokus stehen und wo erste Signale für eine technische Gegenbewegung erkennbar sind.
Autor  Mitrade Team
vor 23 Stunden
Solana fällt unter 150 US-Dollar auf ein Fünf-Monats-Tief, während US-Spot-ETFs die bislang niedrigsten Nettozuflüsse und der Derivatemarkt rückläufiges Open Interest sowie negative Funding-Rates zeigen. Die Analyse erläutert, warum ETF- und Futures-Daten auf anhaltenden Druck hinweisen, welche Unterstützungszonen bei 126 und 100 US-Dollar jetzt im Fokus stehen und wo erste Signale für eine technische Gegenbewegung erkennbar sind.
goTop
quote