EUR/USD struggles near 1.1000 with ECB policy taking centre stage

Quelle Fxstreet
  • EUR/USD exhibits uncertainty near 1.1000 ahead of the ECB’s policy decision.
  • The ECB is expected to cut the Rate On Deposit Facility by 25 bps to 3.5%.
  • Sticky US inflation data cements Fed’s 25 bps interest rate cut prospects for next week’s policy meeting.

EUR/USD struggles near more than a three-week low, around 1.1000 in Thursday’s European session. The major currency pair remains on tenterhooks, with investors focusing on the European Central Bank’s interest rate decision, which will be announced at 12:15 GMT. The ECB is widely anticipated to cut the Rate On Deposit Facility by 25 basis points (bps) to 3.5%.

This will be the second interest rate cut by the ECB in its current policy easing cycle, which it started in June after gaining confidence that inflationary pressures in the Eurozone will return to the central bank’s target of 2% in 2025. The ECB left its key borrowing rates steady in July as officials seemed worried that an aggressive monetary stance could revamp price pressures again.

Market speculation for the ECB reducing interest rates on Thursday strengthened due to a sharp decline in Eurozone price pressures and growing risks to Germany’s economic growth, the largest nation of the old continent. The German economy contracted by 0.1% in the second quarter of the year and is exposed to a recession due to a poor demand environment.

Given that the ECB is almost certain to cut interest rates again on Thursday, investors will keenly focus on cues about the interest rate cut path. “The ECB is unlikely to offer enough information through forward guidance or new economic forecasts to justify another rate cut in October,” “Our house view remains 25bp rate cuts today and December 12”, said Chris Turner, analyst at ING.

Daily digest market movers: EUR/USD remains on the back foot as US Dollar posts fresh weekly high

  • EUR/USD remains under pressure as the US Dollar (USD) refreshes its weekly high during European trading hours on Thursday. The US Dollar Index (DXY), which tracks the Greenback’s value against six major currencies, rises to nearly 101.80. The Greenback gains further as signs of stickiness in the United States (US) Consumer Price Index (CPI) data for August forced traders to pare bets supporting the Federal Reserve (Fed) to start reducing interest rates this month aggressively.
  • Wednesday’s CPI data showed that the annual core inflation – which excludes volatile food and energy prices – rose by 3.2%, as expected. The monthly core CPI rose by 0.3%, faster than estimates and the prior release of 0.2%. However, the annual headline CPI grew by 2.5%, slower than the expected 2.6% and July’s print of 2.9% due to lower energy prices. Historically, Fed officials give more weightage to core inflation as it excludes those volatile items, which are guided by global and environmental forces.
  • The sticky US core inflation data cemented market expectations for the Fed to begin reducing its key borrowing rates gradually. According to the CME FedWatch tool, the probability of the Fed reducing interest rates by 50 basis points (bps) to 4.75%-5.00% in September has diminished to 13% from 40% a week ago.
  • In Thursday’s session, market participants will focus on the US Producer Price Index (PPI) data for August and the Initial Jobless Claims data for the week ending September 6, which will be published at 12:30 GMT. The significance of the jobless claims data has increased as recent comments from an array of Fed officials signal that the central bank has become more concerned about reviving job growth.

Technical Analysis: EUR/USD hovers near 1.1000

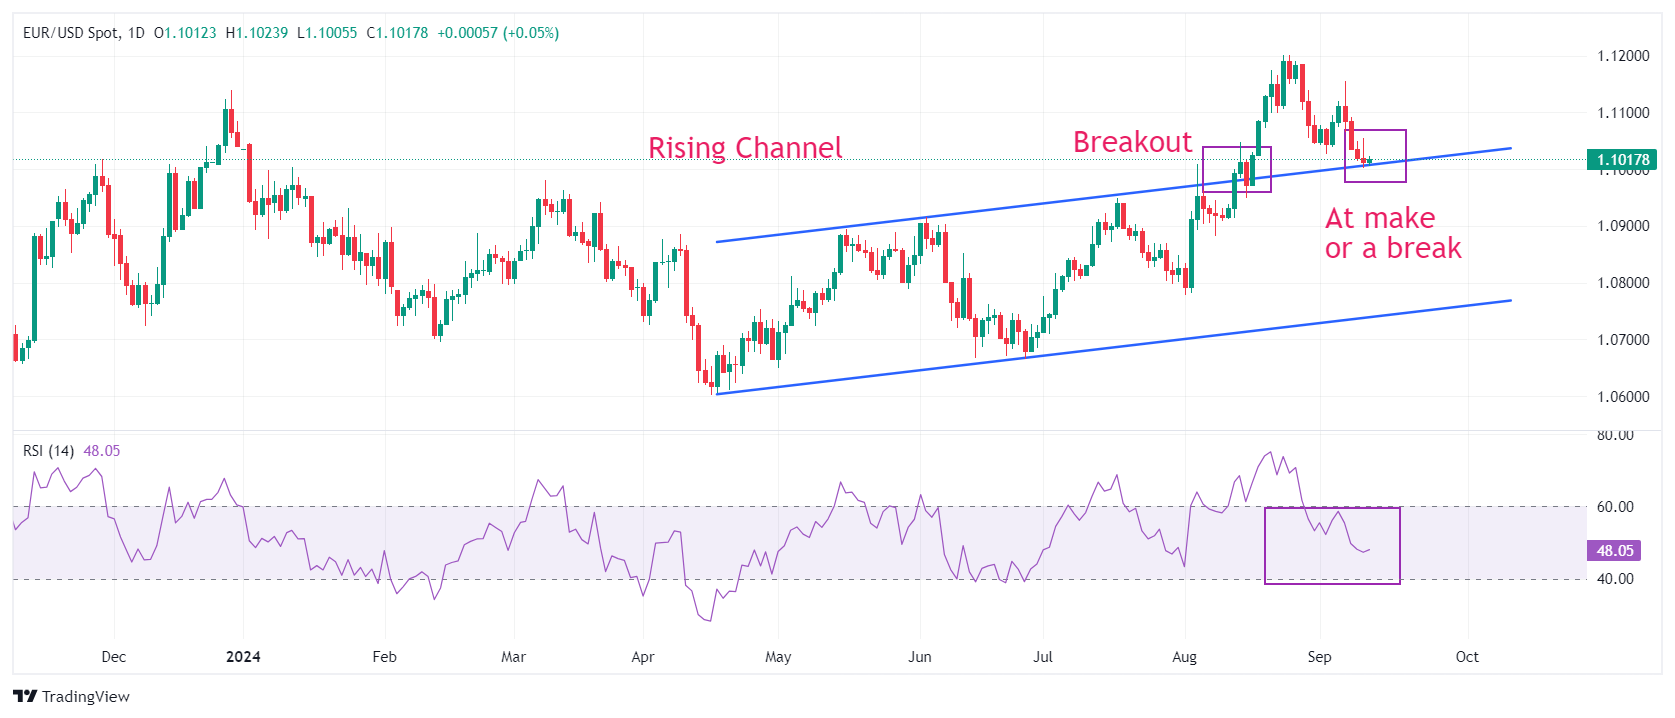
EUR/USD trades at make or a break near 1.1000 ahead of the ECB’s interest rate policy decision. The pair has corrected to near the upper line of a Rising Channel formation in the daily timeframe, from where it delivered a breakout on August 14, which resulted in a sharp upside move. The 20-day Exponential Moving Average (EMA) near 1.1047 acts as a major resistance for the Euro bulls.

The 14-day Relative Strength Index (RSI) falls further below 50.00, suggesting that the near-term outlook is uncertain.

The pair continues to hold the psychological level of 1.1000. A downside move below the same would drag the asset toward the July 17 high near 1.0950. On the upside, last week’s high of 1.1155 and the round-level resistance of 1.1200 will act as major barricades for the Euro bulls. 

Euro FAQs

The Euro is the currency for the 20 European Union countries that belong to the Eurozone. It is the second most heavily traded currency in the world behind the US Dollar. In 2022, it accounted for 31% of all foreign exchange transactions, with an average daily turnover of over $2.2 trillion a day. EUR/USD is the most heavily traded currency pair in the world, accounting for an estimated 30% off all transactions, followed by EUR/JPY (4%), EUR/GBP (3%) and EUR/AUD (2%).

The European Central Bank (ECB) in Frankfurt, Germany, is the reserve bank for the Eurozone. The ECB sets interest rates and manages monetary policy. The ECB’s primary mandate is to maintain price stability, which means either controlling inflation or stimulating growth. Its primary tool is the raising or lowering of interest rates. Relatively high interest rates – or the expectation of higher rates – will usually benefit the Euro and vice versa. The ECB Governing Council makes monetary policy decisions at meetings held eight times a year. Decisions are made by heads of the Eurozone national banks and six permanent members, including the President of the ECB, Christine Lagarde.

Eurozone inflation data, measured by the Harmonized Index of Consumer Prices (HICP), is an important econometric for the Euro. If inflation rises more than expected, especially if above the ECB’s 2% target, it obliges the ECB to raise interest rates to bring it back under control. Relatively high interest rates compared to its counterparts will usually benefit the Euro, as it makes the region more attractive as a place for global investors to park their money.

Data releases gauge the health of the economy and can impact on the Euro. Indicators such as GDP, Manufacturing and Services PMIs, employment, and consumer sentiment surveys can all influence the direction of the single currency. A strong economy is good for the Euro. Not only does it attract more foreign investment but it may encourage the ECB to put up interest rates, which will directly strengthen the Euro. Otherwise, if economic data is weak, the Euro is likely to fall. Economic data for the four largest economies in the euro area (Germany, France, Italy and Spain) are especially significant, as they account for 75% of the Eurozone’s economy.

Another significant data release for the Euro is the Trade Balance. This indicator measures the difference between what a country earns from its exports and what it spends on imports over a given period. If a country produces highly sought after exports then its currency will gain in value purely from the extra demand created from foreign buyers seeking to purchase these goods. Therefore, a positive net Trade Balance strengthens a currency and vice versa for a negative balance.


Haftungsausschluss: Nur zu Informationszwecken. Die bisherige Performance ist kein verlässlicher Indikator für zukünftige Ergebnisse.
placeholder
Silberpreis-Prognose: XAG/USD steigt auf fast 84,50 US-Dollar im überkauften BereichDer Silberpreis (XAG/USD) gewinnt zum zweiten aufeinanderfolgenden Tag an Boden und handelt in den frühen europäischen Stunden am Montag um die Marke von 84,30 USD je Feinunze.
Autor  FXStreet
Mo. 12.Jan
Der Silberpreis (XAG/USD) gewinnt zum zweiten aufeinanderfolgenden Tag an Boden und handelt in den frühen europäischen Stunden am Montag um die Marke von 84,30 USD je Feinunze.
placeholder
Silberpreis heute: Silber steigt laut FXStreet-DatenDie Preise für Silber (XAG/USD) stiegen am Montag, wie aus FXStreet-Daten hervorgeht. Der Silberpreis liegt bei 109,94 USD pro Unze, was einem Anstieg von 7,28 % gegenüber den 102,48 USD vom Freitag entspricht
Autor  FXStreet
Mo. 26.Jan
Die Preise für Silber (XAG/USD) stiegen am Montag, wie aus FXStreet-Daten hervorgeht. Der Silberpreis liegt bei 109,94 USD pro Unze, was einem Anstieg von 7,28 % gegenüber den 102,48 USD vom Freitag entspricht
placeholder
Silber steigt in Asien auf 113,50 US-Dollar – Safe-Haven-Nachfrage und Fed im FokusSilber (XAG/USD) steigt am Mittwoch in Asien auf 113,50 US-Dollar (+1,30%), gestützt von Dollar-Schwäche, Safe-Haven-Nachfrage und Zinssenkungsfantasie, während die Fed-Entscheidung und mögliche Gewinnmitnahmen nach über 200% Jahresplus im Fokus stehen.
Autor  Mitrade Team
Mi. 28.Jan
Silber (XAG/USD) steigt am Mittwoch in Asien auf 113,50 US-Dollar (+1,30%), gestützt von Dollar-Schwäche, Safe-Haven-Nachfrage und Zinssenkungsfantasie, während die Fed-Entscheidung und mögliche Gewinnmitnahmen nach über 200% Jahresplus im Fokus stehen.
placeholder
Krypto-Ausblick: Bitcoin stabilisiert sich über 87.787 US-Dollar – Ether vor der nächsten Hürde, XRP bleibt fragil• Bitcoin pendelt am Mittwoch um 89.000 US-Dollar und hat sich nach der Vorwochenkorrektur bislang um knapp 3% erholt – entscheidend bleibt die Zone um 87.787 US-Dollar. • Ethereum arbeitet sich an die Widerstandszone heran: Erst ein Tagesschluss über 3.017 US-Dollar und der 50-Tage-EMA bei 3.101 US-Dollar würde den Weg nach oben freimachen. • XRP prallt von 1,83 US-Dollar ab und steht wieder bei 1,90 US-Dollar – doch RSI und MACD sprechen weiter für Vorsicht. Nach der kräftigen Korrektur der vergangenen Woche setzt sich im Kryptomarkt eine vorsichtige Stabilisierung durch. Bitcoin, Ether und XRP bauen ihre Erholung aus, stoßen nun aber auf charttechnisch wichtige Marken, an denen sich entscheidet, ob aus der Gegenbewegung mehr wird – oder ob der nächste Rücksetzer folgt. Bitcoin: 87.787 US-Dollar bleibt der Dreh- und Angelpunkt Bitcoin hat am Montag nach der 7,48%-Korrektur der Vorwoche wieder oberhalb der Mittellinie eines horizontalen Parallelkanals bei 87.787 US-Dollar geschlossen. Am Dienstag verteidigte der Kurs diese Zone erneut, am Mittwoch notiert BTC bei rund 89.300 US-Dollar. Hält 87.787 US-Dollar als Support, rückt die obere Begrenzung des Musters bei 90.000 US-Dollar in den Fokus. Der RSI (Tag) liegt bei 45 und steigt in Richtung der neutralen 50 – ein Hinweis auf nachlassenden Verkaufsdruck. Auch der MACD entspannt sich: Die Linien nähern sich an, die roten Histogrammbalken unterhalb der Nulllinie werden schwächer. Bricht Bitcoin dagegen per Tagesschluss wieder unter 87.787 US-Dollar, bleibt die Unterseite anfällig – dann würde die nächste Auffangzone bei 85.569 US-Dollar (zugleich 78,6% Fibonacci-Retracement) wieder relevant. Ethereum: Erst über 3.017 und 3.101 US-Dollar wird es konstruktiver Ethereum startete positiv in die Woche und legte bis Dienstag um 7,62% zu – nach der 14,22%-Korrektur in der Woche davor. Am Mittwoch nähert sich ETH dem zentralen Widerstand bei 3.017 US-Dollar. Für ein klareres Erholungssignal braucht es mehr als nur Intraday-Stärke: Ein Ausbruch über 3.017 US-Dollar und ein Tagesschluss über dem 50-Tage-EMA bei 3.101 US-Dollar könnten den Blick in Richtung des Hochs vom 14. Januar bei 3.402 US-Dollar lenken. Die Momentum-Indikatoren (RSI und MACD) deuten zwar auf nachlassenden Abwärtsdruck hin, aber das Setup bleibt empfindlich. Kommt es stattdessen zu einer erneuten Abweisung an der Widerstandszone, rückt auf der Unterseite das 61,8% Fibonacci-Retracement bei 2.749 US-Dollar wieder ins Blickfeld. XRP: Rebound ja – Trendwende noch nicht XRP hat am Sonntag die tägliche Unterstützung bei 1,83 US-Dollar getestet und anschließend binnen zwei Tagen um 4,51% zugelegt. Am Mittwoch handelt der Kurs bei 1,90 US-Dollar. Solange 1,83 US-Dollar hält, kann sich die Erholung in Richtung des nächsten Widerstands bei 1,96 US-Dollar fortsetzen. Allerdings ist der Unterton noch nicht gedreht: Der RSI liegt bei 42 und damit weiter unter der neutralen 50. Zudem bleibt das Bild im MACD belastet – das bärische Crossover der Vorwoche ist weiterhin aktiv, was das Rückschlagrisiko erhöht. Fällt XRP per Tagesschluss erneut unter 1,83 US-Dollar, wäre ein weiterer Abwärtsimpuls bis zum Tief vom 19. Dezember bei 1,77 US-Dollar wieder ein realistisches Szenario.
Autor  Mitrade Team
Mi. 28.Jan
• Bitcoin pendelt am Mittwoch um 89.000 US-Dollar und hat sich nach der Vorwochenkorrektur bislang um knapp 3% erholt – entscheidend bleibt die Zone um 87.787 US-Dollar. • Ethereum arbeitet sich an die Widerstandszone heran: Erst ein Tagesschluss über 3.017 US-Dollar und der 50-Tage-EMA bei 3.101 US-Dollar würde den Weg nach oben freimachen. • XRP prallt von 1,83 US-Dollar ab und steht wieder bei 1,90 US-Dollar – doch RSI und MACD sprechen weiter für Vorsicht. Nach der kräftigen Korrektur der vergangenen Woche setzt sich im Kryptomarkt eine vorsichtige Stabilisierung durch. Bitcoin, Ether und XRP bauen ihre Erholung aus, stoßen nun aber auf charttechnisch wichtige Marken, an denen sich entscheidet, ob aus der Gegenbewegung mehr wird – oder ob der nächste Rücksetzer folgt. Bitcoin: 87.787 US-Dollar bleibt der Dreh- und Angelpunkt Bitcoin hat am Montag nach der 7,48%-Korrektur der Vorwoche wieder oberhalb der Mittellinie eines horizontalen Parallelkanals bei 87.787 US-Dollar geschlossen. Am Dienstag verteidigte der Kurs diese Zone erneut, am Mittwoch notiert BTC bei rund 89.300 US-Dollar. Hält 87.787 US-Dollar als Support, rückt die obere Begrenzung des Musters bei 90.000 US-Dollar in den Fokus. Der RSI (Tag) liegt bei 45 und steigt in Richtung der neutralen 50 – ein Hinweis auf nachlassenden Verkaufsdruck. Auch der MACD entspannt sich: Die Linien nähern sich an, die roten Histogrammbalken unterhalb der Nulllinie werden schwächer. Bricht Bitcoin dagegen per Tagesschluss wieder unter 87.787 US-Dollar, bleibt die Unterseite anfällig – dann würde die nächste Auffangzone bei 85.569 US-Dollar (zugleich 78,6% Fibonacci-Retracement) wieder relevant. Ethereum: Erst über 3.017 und 3.101 US-Dollar wird es konstruktiver Ethereum startete positiv in die Woche und legte bis Dienstag um 7,62% zu – nach der 14,22%-Korrektur in der Woche davor. Am Mittwoch nähert sich ETH dem zentralen Widerstand bei 3.017 US-Dollar. Für ein klareres Erholungssignal braucht es mehr als nur Intraday-Stärke: Ein Ausbruch über 3.017 US-Dollar und ein Tagesschluss über dem 50-Tage-EMA bei 3.101 US-Dollar könnten den Blick in Richtung des Hochs vom 14. Januar bei 3.402 US-Dollar lenken. Die Momentum-Indikatoren (RSI und MACD) deuten zwar auf nachlassenden Abwärtsdruck hin, aber das Setup bleibt empfindlich. Kommt es stattdessen zu einer erneuten Abweisung an der Widerstandszone, rückt auf der Unterseite das 61,8% Fibonacci-Retracement bei 2.749 US-Dollar wieder ins Blickfeld. XRP: Rebound ja – Trendwende noch nicht XRP hat am Sonntag die tägliche Unterstützung bei 1,83 US-Dollar getestet und anschließend binnen zwei Tagen um 4,51% zugelegt. Am Mittwoch handelt der Kurs bei 1,90 US-Dollar. Solange 1,83 US-Dollar hält, kann sich die Erholung in Richtung des nächsten Widerstands bei 1,96 US-Dollar fortsetzen. Allerdings ist der Unterton noch nicht gedreht: Der RSI liegt bei 42 und damit weiter unter der neutralen 50. Zudem bleibt das Bild im MACD belastet – das bärische Crossover der Vorwoche ist weiterhin aktiv, was das Rückschlagrisiko erhöht. Fällt XRP per Tagesschluss erneut unter 1,83 US-Dollar, wäre ein weiterer Abwärtsimpuls bis zum Tief vom 19. Dezember bei 1,77 US-Dollar wieder ein realistisches Szenario.
placeholder
Gold fällt, da die Einigung über die Regierungsfinanzierung den USD stärkt und Gewinnmitnahmen auslöstGold (XAU/USD) erlebt am Freitag zum zweiten Mal in Folge eine starke Liquidation, nachdem es seit Beginn dieses Monats um mehr als 25% parabolisch gestiegen ist und in den letzten zwei Wochen eine Reihe von Rekordhochs erreicht hat.
Autor  FXStreet
Fr. 30.Jan
Gold (XAU/USD) erlebt am Freitag zum zweiten Mal in Folge eine starke Liquidation, nachdem es seit Beginn dieses Monats um mehr als 25% parabolisch gestiegen ist und in den letzten zwei Wochen eine Reihe von Rekordhochs erreicht hat.
verbundene Finanzinstrumente
goTop
quote