AUD/JPY Price Analysis: Rebounds slightly, awaits continuation of correction

Quelle Fxstreet
  • AUD/JPY shows a minor correction to the upside, landing at 100.70, yet records a losing week.
  • The short-term bearish trend continues, despite the minor gains, as the pair has lost more than 7% since June.
  • The 200-day SMA near 100.00 continues to be a key support level to prevent further losses.

In Friday's session, the AUD/JPY pair showed a minor recovery, rising by 0.15% to end at 100.79. Despite this, the overall control of sellers remains, as the pair closes on a 4.30% losing week, solidifying the bearish outlook. The bounce may be an indication of a possible breather for the bears and could suggest further corrective movements in the upcoming sessions.

The daily Relative Strength Index (RSI) saw an increase from its previous levels, reaching 23, hinting at a possible easing in the bearish momentum. However, it still firmly stays in the oversold territory providing a potential signal for the continuation of the correction. In sync, the Moving Average Convergence Divergence (MACD) continues to display flat red bars, indicating persistent selling activity.

AUD/JPY daily chart

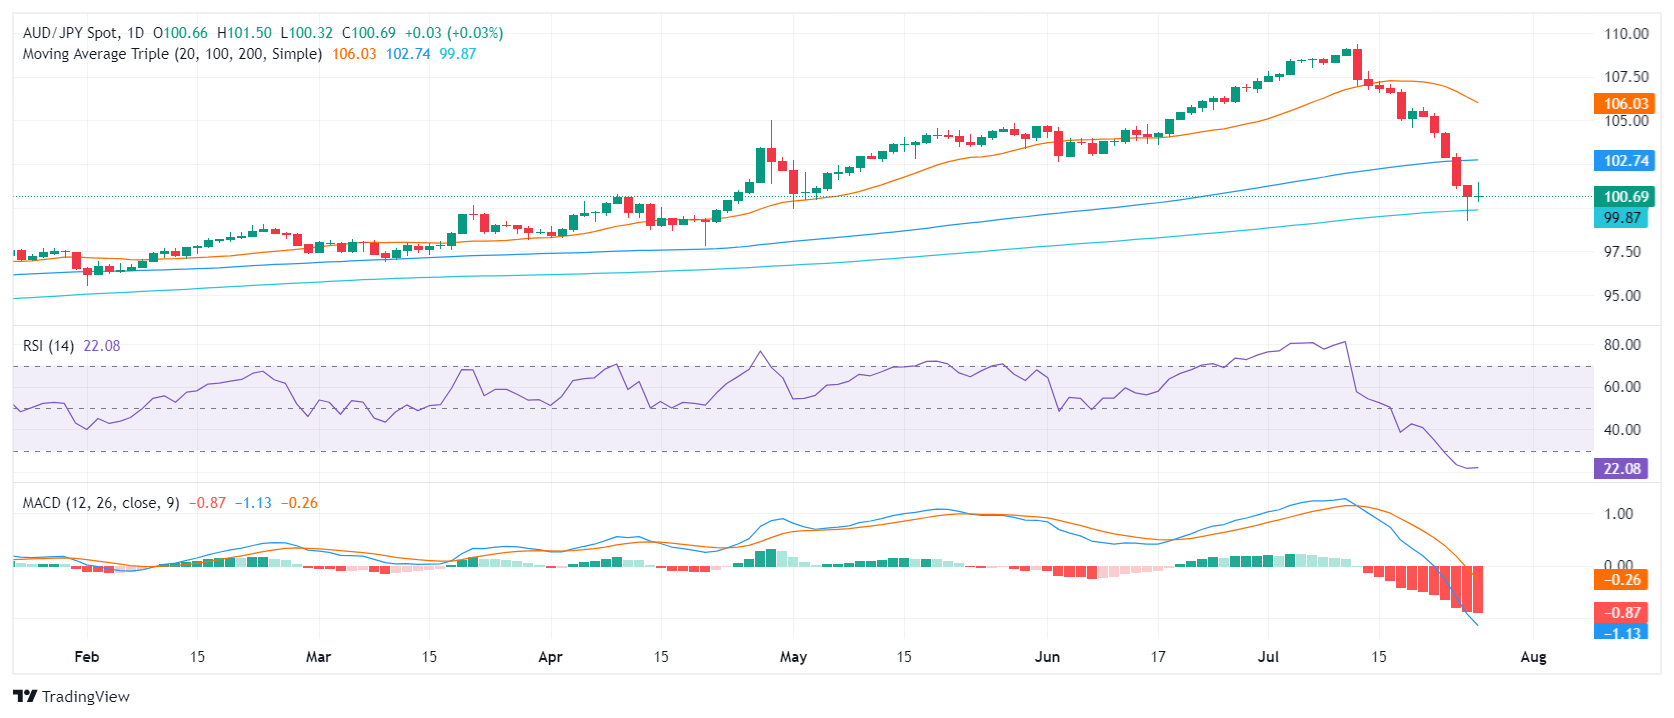
Keeping a wider perspective, the short-term bearish trend of AUD/JPY remains intact. Having lost the 100-day SMA, the pair now encounters a major hurdle at the 200-day SMA. Despite the support here reinvigorating the bulls momentarily, it's crucial to note the pair remains in the oversold territory, based on its RSI.

Moving forward, the pair needs to maintain a footing at the 200-day SMA at 100.00, a vital support level. On the downside, levels to watch remain around the 99.50 and 99.30 marks. For a potential recovery, buyers should aim at surpassing the immediate resistance at 101.00 and target 102.70 points where the 100-day SMA converges to offset potential losses.

Haftungsausschluss: Nur zu Informationszwecken. Die bisherige Performance ist kein verlässlicher Indikator für zukünftige Ergebnisse.
placeholder
Ripple im Geheimmodus: Bereitet sich XRP auf 26 $ bis 2026 vor?Der XRP-Kurs zeigt derzeit klare Anzeichen einer Konsolidierung.
Autor  FXStreet
Do. 23.Okt
Der XRP-Kurs zeigt derzeit klare Anzeichen einer Konsolidierung.
placeholder
XRP: Was Ripple dir JETZT nicht offen sagtDer XRP-Kurs wirkt auf den ersten Blick enttäuschend. Seit Tagen geht es kaum vorwärts, der Preis schwankt, Hoffnung kommt auf – und wird direkt wieder kassiert. Aktuell notiert Ripple bei rund 1,99 US-Dollar. Doch genau jetzt lohnt es sich hinzusehen.
Autor  FXStreet
Mo. 15.Dez
Der XRP-Kurs wirkt auf den ersten Blick enttäuschend. Seit Tagen geht es kaum vorwärts, der Preis schwankt, Hoffnung kommt auf – und wird direkt wieder kassiert. Aktuell notiert Ripple bei rund 1,99 US-Dollar. Doch genau jetzt lohnt es sich hinzusehen.
placeholder
Silber-Prognose: XAG/USD markiert neues Rekordhoch nahe 66 US-Dollar – schwache US-Daten treiben Safe-Haven-NachfrageSilber (XAG/USD) erreicht in Asien ein neues Allzeithoch nahe 66 US-Dollar, getragen von schwachen US-Daten (Arbeitslosenquote 4,6 %, flache Retail Sales, PMI 53,0) und Safe-Haven-Nachfrage; technisch stützt die 20-EMA bei 63,28, während der RSI bei 69,16 nahe überkauft liegt und bei anhaltender Stärke weitere Ziele Richtung 70 US-Dollar offen bleiben.
Autor  Mitrade Team
Gestern 03: 34
Silber (XAG/USD) erreicht in Asien ein neues Allzeithoch nahe 66 US-Dollar, getragen von schwachen US-Daten (Arbeitslosenquote 4,6 %, flache Retail Sales, PMI 53,0) und Safe-Haven-Nachfrage; technisch stützt die 20-EMA bei 63,28, während der RSI bei 69,16 nahe überkauft liegt und bei anhaltender Stärke weitere Ziele Richtung 70 US-Dollar offen bleiben.
placeholder
Bitcoin und Ethereum mit Zickzack-Move: Heftige Liquidationen nach Vorwürfen möglicher MarktmanipulationBitcoin und Ethereum drehten am Mittwoch nach einem schnellen Anstieg (BTC 86.000→>90.000→~85.000; ETH 2.900→3.100→2.800) abrupt ins Minus und lösten laut Coinglass über 400 Mio. USD Liquidationen aus, während ETF-Abflüsse von >1 Mrd. USD (SoSoValue) und Kommentare von Amberdata auf fragile Marktstruktur und mögliche weitere Referenzzonen bei 80K/60K hinweisen.
Autor  Mitrade Team
vor 7 Stunden
Bitcoin und Ethereum drehten am Mittwoch nach einem schnellen Anstieg (BTC 86.000→>90.000→~85.000; ETH 2.900→3.100→2.800) abrupt ins Minus und lösten laut Coinglass über 400 Mio. USD Liquidationen aus, während ETF-Abflüsse von >1 Mrd. USD (SoSoValue) und Kommentare von Amberdata auf fragile Marktstruktur und mögliche weitere Referenzzonen bei 80K/60K hinweisen.
placeholder
Gold gibt nach: Gewinnmitnahmen und festerer Dollar vor US-CPI – Abwärtsrisiko bleibt begrenztGold fällt in Asien unter $4,350 nach Gewinnmitnahmen und einem festeren USD vor dem US-CPI (erwartet 3,1% YoY; Kern 3,0%), während Fed-Senkungserwartungen und geopolitische Risiken (Venezuela/Blockade) die Abwärtsseite begrenzen könnten; technisch bleibt oberhalb der 100-Tage-EMA das Aufwärtsbild intakt, mit Triggern bei $4,352, $4,300 und $4,271.
Autor  Mitrade Team
vor 6 Stunden
Gold fällt in Asien unter $4,350 nach Gewinnmitnahmen und einem festeren USD vor dem US-CPI (erwartet 3,1% YoY; Kern 3,0%), während Fed-Senkungserwartungen und geopolitische Risiken (Venezuela/Blockade) die Abwärtsseite begrenzen könnten; technisch bleibt oberhalb der 100-Tage-EMA das Aufwärtsbild intakt, mit Triggern bei $4,352, $4,300 und $4,271.
verbundene Finanzinstrumente
goTop
quote