


The S&P 500 Just Reached a New Record. Here’s What History Says About Buying Stocks Now.
Key Points
The S&P 500 is heading for a 14% increase this year.
Positive momentum has reigned, but the index has faced and continues to face various headwinds.
- 10 stocks we like better than S&P 500 Index ›
The S&P 500 has been through ups and downs this year, slipping on occasion amid worries about the economy, turmoil in Iran, and spending on artificial intelligence (AI). But overall, the famous benchmark has maintained its bull-market strength, extending its three-year 78% gain. In fact, the S&P 500, heading for an increase of 14% in 2026, just reached a new record high this week.
Against this backdrop, investors may either be excited about investing and getting in on this momentum or be hesitant to buy stocks with the idea that the market may have reached its peak and declines could follow. These two sentiments might even be among the forces pushing the index to gains one day and declines the next.
Missed Nvidia in 2009? This Rare Signal Is Flashing Again. In 2009, a "Double Down" signal flashed for a little-known chipmaker called Nvidia. For the first time in years, that same "Total Conviction" signal is flashing for a company 1/100th the size of Nvidia. Continue »
So, should you really invest during such an environment? Let's consider what history says about buying stocks now.

Image source: Getty Images.
Investors rush to AI stocks
First, we'll talk about the elements that have pushed the index higher in recent years and months, as well as the headwinds that have slowed the pace. Investors have rushed to get in on AI stocks, from Nvidia to Microsoft, over the past few years as a bet on what could be the next big thing in technology. The bet has been a winning one so far, as many of these players have climbed in the double and triple digits. AI has demonstrated its potential to help companies become faster and better at what they do, and this could significantly boost earnings over time.
But this AI development has required major investment and will continue to involve such investment. This year alone, big tech players are pouring nearly $700 billion into infrastructure, and though this is in response to high demand, it has worried some investors. The concern is that the revenue opportunity may not justify such an enormous investment. This has prompted some investors to turn away from AI stocks, at least temporarily, in recent months. Meanwhile, general uncertainty about the economy and geopolitical situation has also led to declines, particularly among growth stocks, at certain points this year.
Still, overall, optimism has reigned, helping the market recover from tough days and pushing the S&P 500 higher. On Tuesday, the index closed above 7,800 for the first time.
Should you get in on this momentum?
Now, you might be wondering if you should get in on this positive momentum or whether the S&P 500's arrival at a fresh peak may signal trouble ahead. It's true that the market has been advancing for quite some time, and with valuations high, a decline could be on the horizon. The S&P 500 Shiller CAPE ratio, an inflation-adjusted look at price in relation to earnings, has reached a historically high level. And this may not be sustainable.
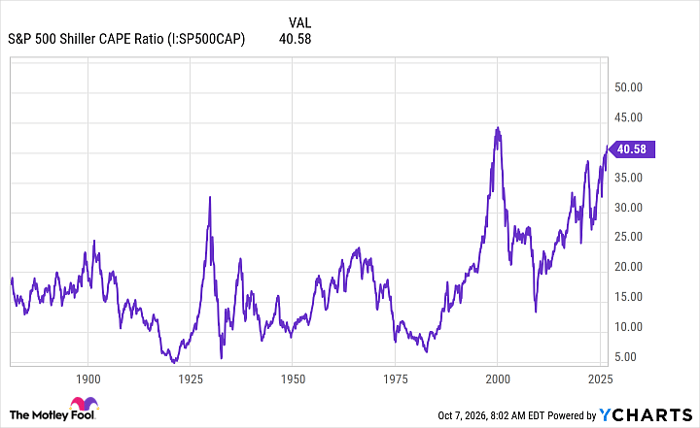
S&P 500 Shiller CAPE Ratio data by YCharts
Clearly, if you buy stocks today and the market continues to rise for months or years, you've made the right move. The concern is: What if you buy today, and the market has reached its peak? Let's zoom in on what history says about such a scenario.
Capital Group describes a hypothetical investment over a 20-year period in the S&P 500 ending last year. Investor A invested each year on the day when the market hit its lowest, while Investor B invested each year on the day when the market reached its highest. The average annual return for these investors was 14.65% and 12.64%, respectively, according to the data. That isn't a huge difference in returns.
So, history offers us some good news: It doesn't really matter when you invest -- you could even invest on the worst possible day every year -- but if you hold on over time, you're likely to score an investing win.
What that means is that, today, you shouldn't worry about whether the market has reached a peak or not. You don't have to wait for a particular moment to start investing or to add to your current portfolio. Instead, during any market environment, you should continue looking for quality stocks trading at reasonable levels -- and buy and hold for the long term.
Should you buy stock in S&P 500 Index right now?
Before you buy stock in S&P 500 Index, consider this:
The Motley Fool Stock Advisor analyst team just identified what they believe are the 10 best stocks for investors to buy now… and S&P 500 Index wasn’t one of them. The 10 stocks that made the cut could produce monster returns in the coming years.
Consider when Netflix made this list on December 17, 2004... if you invested $1,000 at the time of our recommendation, you’d have $370,440!* Or when Nvidia made this list on April 15, 2005... if you invested $1,000 at the time of our recommendation, you’d have $1,470,022!*
Now, it’s worth noting Stock Advisor’s total average return is 955% — a market-crushing outperformance compared to 215% for the S&P 500. Don't miss the latest top 10 list, available with Stock Advisor, and join an investing community built by individual investors for individual investors.
See the 10 stocks »
*Stock Advisor returns as of October 7, 2026.
Adria Cimino has no position in any of the stocks mentioned. The Motley Fool has positions in and recommends Microsoft and Nvidia. The Motley Fool has a disclosure policy.
Recommended Articles


