


The S&P 500 Has Never Been Lower 12 Months After a Midterm Election. Not Once in 19 Tries. Here's Whether 2026 Could Finally Break That Streak.
Key Points
The S&P 500 has always risen in the 12 months following a midterm election.
Midterm elections remove uncertainty and often lead to a divided U.S. government.
Historically high market valuations, though, could cause the streak to be broken.
- These 10 stocks could mint the next wave of millionaires ›
Midterm election years tend to be volatile periods for the stock market. This year has been no exception, even with the S&P 500 (SNPINDEX:^GSPC) up around 13%.
However, midterm elections have historically been cathartic for the market. You might be surprised by this, but the S&P 500 has never been lower 12 months after a midterm election. But could that change after the 2026 vote?
Missed AI’s "Act 1"? Act 2 Could Be 15x Bigger. Most investors think they missed the AI boat because they didn't buy Nvidia in 2005. But according to our analysts, we’re only at the end of "Act 1"—the R&D phase. "Act 2" is the global rollout. Continue »

Image source: Getty Images.
A reliable historical pattern
The S&P 500 was created in its current form with 500 companies in 1950. Since then, there have been 19 midterm elections in the U.S. The index delivered positive returns over the 12 months following each of those elections.
This historical pattern is both reliable and remarkable. The 12-month windows after those midterm election years included some challenging periods, including the Korean War and the 1973 oil shock.
We're not talking about paltry gains, either. The S&P 500's average return 12 months after a midterm election is roughly 15% since 1950. Robert W. Baird & Co. calculated that the index jumped an average of 32% over one year following the midterm-year bottom.
The trend also goes back before the S&P 500 was created. Fidelity Investments found that the index and its predecessor have risen 95% of the time in the 12 months following midterm elections since 1938.
There are several theories about why this pattern exists. Probably the best explanation is that midterm elections end political uncertainty -- and markets hate uncertainty. Whichever political party is not in the White House also typically gains congressional seats in midterm elections. The stock market tends to perform better when there's divided government.
Why the streak could be broken
Could the S&P 500's streak of delivering positive returns following the last 19 midterm elections be broken? It's a definite maybe.
Perhaps the most important factor increasing the likelihood that the S&P 500 won't be higher one year after the upcoming November elections is valuation. The stock market is priced at a steep premium compared to most of its history.
The S&P 500 Shiller CAPE (cyclically-adjusted price-to-earnings) ratio is near its second-highest level ever. The only time the ratio was higher was in late 1999 and early 2000, right before the dot-com bubble burst, leading to an infamous stock market crash.
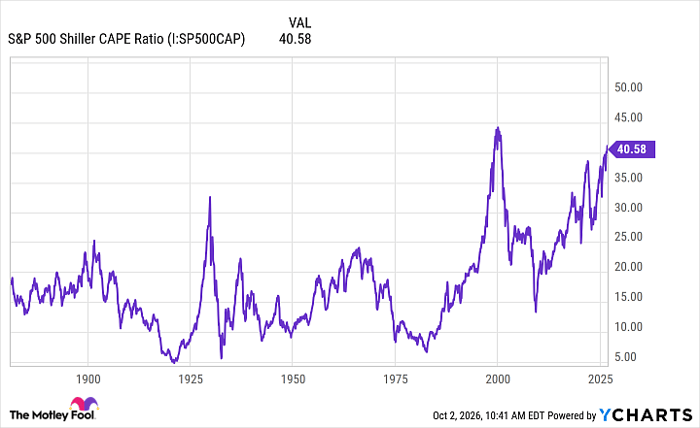
S&P 500 Shiller CAPE Ratio data by YCharts
Another valuation metric is even more concerning. The ratio of total stock market capitalization to gross domestic product (GDP) stands at roughly 235%, slightly below its all-time high of nearly 237% set in August 2026.
This metric is known popularly as the Buffett indicator after legendary investor Warren Buffett. Nearly 25 years ago, Buffett warned that when the ratio approaches 200%, investors are "playing with fire."
A prediction
I'll step out on a limb and predict that the S&P 500 will keep its post-midterm election streak going in 2027. Granted, the stock market's valuation is a concern. However, the good news is that corporate earnings are growing faster than valuations. I suspect that a bear market will be held at bay as long as this trend continues.
Political prognostications also factor into my view. The prospects for the Democrats regaining control of the U.S. House of Representatives look very good right now. Kalshi's prediction market pegs the probability at 91.4%. Polymarket shows a 93% chance that the Democrats take the House.
Kalshi and Polymarket show lower odds of the Democratic Party winning enough seats to control the Senate. However, both prediction markets have this probability at 63% or higher. Even if the GOP holds onto the Senate, it seems likely that the U.S. will have a divided government come January 2027. As mentioned earlier, divided governments are usually good for the stock market.
My prediction could be wrong. The midterm election pattern for stocks in place for the last 76 years could be blown to smithereens. However, if history is any guide, the market will rise over the 12 months after Nov. 3, 2026. And history is often a pretty good guide.
Where to invest $1,000 right now
When our analyst team has a stock tip, it can pay to listen. After all, Stock Advisor’s total average return is 936%* — a market-crushing outperformance compared to 213% for the S&P 500.
They just revealed what they believe are the 10 best stocks for investors to buy right now, available when you join Stock Advisor.
See the stocks »
*Stock Advisor returns as of October 5, 2026.
Keith Speights has no position in any of the stocks mentioned. The Motley Fool has no position in any of the stocks mentioned. The Motley Fool has a disclosure policy.
Recommended Articles


