


PDD Holdings Inc Stock (PDD) Moved Up by 3.08% on Oct 5: Facts Behind the Movement
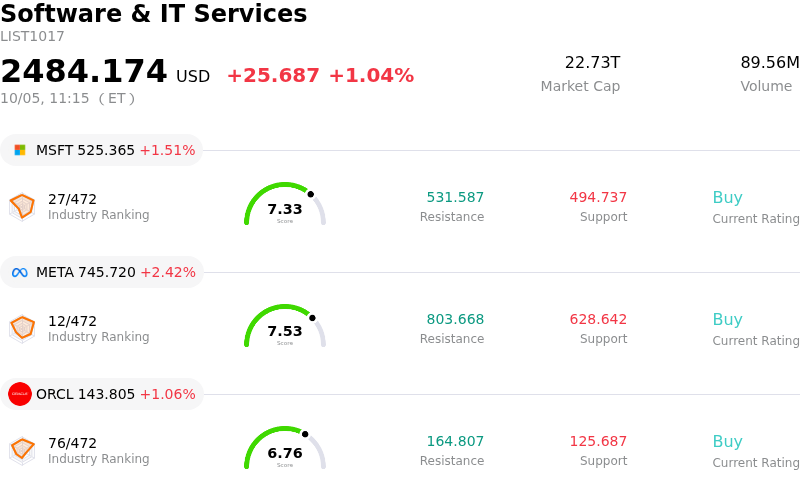
PDD Holdings Inc (PDD) moved up by 3.08%. The Software & IT Services sector is up by 1.04%. The company outperformed the industry. Top 3 stocks by turnover in the sector: Microsoft Corp (MSFT) up 1.51%; Meta Platforms Inc (META) up 2.42%; Oracle Corp (ORCL) up 1.06%.
What is driving PDD Holdings Inc (PDD)’s stock price up today?
PDD Holdings experienced a notable upward move accompanied by heightened intraday volatility, primarily driven by a broader sentiment recovery across Chinese consumer discretionary and technology ADRs. Following an extended selloff that brought the stock near multi-year valuation lows, bargain-hunting and technical short-covering emerged near key technical support zones. Investors are recalibrating their expectations for Chinese cross-border and domestic e-commerce platforms amid ongoing macroeconomic stabilization efforts in China and a sector-wide rebound.
From a fundamental perspective, market participants are increasingly weighing PDD's strategic investment cycle against its deeply compressed valuation multiples. The company has committed substantial capital toward upgrading its merchant ecosystem, strengthening its domestic supply chain infrastructure, and absorbing rising international compliance and logistical costs for its Temu platform. While these strategic initiatives have pressured near-term operating margins and quarterly net earnings, the stock's valuation discount relative to historical averages and its massive net cash balance—representing a major fraction of its total market capitalization—are attracting value-oriented institutional investors.
Intraday trading dynamics further highlight institutional portfolio realignments as market participants assess the long-term payoff of PDD's global expansion against near-term regulatory and margin headwinds. Despite cross-border trade policy shifts and fierce domestic price competition, PDD continues to generate robust core cash flows supported by a resilient balance sheet. Today's upward movement underscores growing market recognition of an asymmetric risk-reward profile, where heavy near-term investment spend is increasingly priced into the stock, leaving room for valuation recovery upon operational stabilization.
Technical Analysis of PDD Holdings Inc (PDD)
Technically, PDD Holdings Inc (PDD) shows a MACD (12,26,9) value of 0.147, indicating a neutral signal. The RSI at 43.250 suggests neutral condition and the Williams %R at 49.934 suggests neutral condition. Please monitor closely.
Fundamental Analysis of PDD Holdings Inc (PDD)
PDD Holdings Inc (PDD) is in the Software & IT Services industry. Its latest annual revenue is $62.58B, ranking 9 in the industry. The net profit is $14.18B, ranking 9 in the industry. Company Profile
Over the past month, multiple analysts have rated the company as Buy, with an average price target of $113.66, a high of $150.00, and a low of $17.56.
More details about PDD Holdings Inc (PDD)
Company Specific Risks:
- Overseas Regulatory & Tax Pressures: Intensifying regulatory actions in international markets—including European Commission fines of €200 million ($232 million) under the Digital Services Act and the implementation of cross-border parcel fees—are compressing Temu's gross margins and raising international fulfillment costs.
- Decelerating Core Ad Growth and Earnings Contraction: Recent quarterly results highlight a growth slowdown in high-margin Online Marketing Services (OMS) alongside a 12% to 15% year-over-year decline in net income, prompting institutional analysts to downgrade the stock to Neutral/Hold due to reduced revenue visibility.
- Aggressive Ecosystem Reinvestment Squeezing Operating Margins: Management's commitment to deploy over RMB 100 billion in merchant support and supply-chain logistics is transitioning PDD from an asset-light model to a capital-intensive structure, suppressing short-term profitability.
- Litigation Overhang and Compliance Liabilities: Ongoing shareholder class-action litigation in U.S. federal court regarding Temu's supply chain transparency, forced labor scrutiny, and data governance practices continues to generate legal uncertainties and depress market sentiment.
Recommended Articles


