


Applovin Corp Stock (APP) Moved Up by 5.81% on Oct 5: Facts Behind the Movement
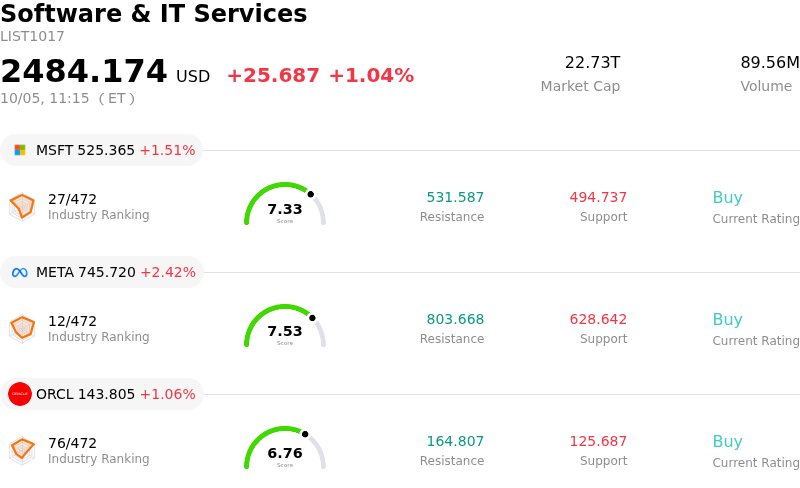
Applovin Corp (APP) moved up by 5.81%. The Software & IT Services sector is up by 1.04%. The company outperformed the industry. Top 3 stocks by turnover in the sector: Microsoft Corp (MSFT) up 1.51%; Meta Platforms Inc (META) up 2.42%; Oracle Corp (ORCL) up 1.06%.
What is driving Applovin Corp (APP)’s stock price up today?
AppLovin experienced a strong upward move accompanied by heightened intraday volatility, driven primarily by value-oriented dip-buying following a prolonged pull-back. After facing downward pressure over recent months due to broader ad-tech sector volatility, legal disclosures, and market scrutiny surrounding quarter-over-quarter growth rates, institutional investors stepped in to capitalize on a compressed valuation. Trading at a notable discount relative to its earnings growth profile and historical multiples, the equity triggered short covering and aggressive buying near key technical support zones.
The core fundamental catalyst reinforcing investor optimism is the ongoing scaling of AppLovin's proprietary AXON AI-powered advertising engine. Market sentiment has been buoyed by the platform's expansion from mobile gaming into the broader direct-to-consumer e-commerce category. As self-serve access for non-gaming advertisers gains adoption ahead of the peak fourth-quarter holiday shopping season, market participants are pricing in potential revenue reacceleration and sustained high margin performance.
Reaffirmed confidence from Wall Street research desks further bolstered price action. Analysts highlighted the company's category leadership in AI performance marketing, exceptionally high EBITDA margin profile, and robust free cash flow generation. With third-quarter earnings on the horizon, the intraday volatility reflects an active repositioning by traders anticipating that previous operational concerns may have been overly discounted.
Technical Analysis of Applovin Corp (APP)
Technically, Applovin Corp (APP) shows a MACD (12,26,9) value of -5.774, indicating a sell signal. The RSI at 37.573 suggests neutral condition and the Williams %R at 75.428 suggests sell condition. Please monitor closely.
Media Coverage of Applovin Corp (APP)
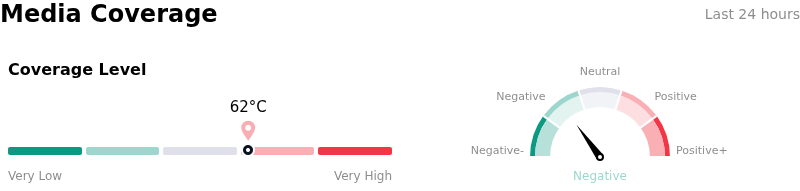
In terms of media coverage, Applovin Corp (APP) shows a coverage score of 62, indicating a high level of media attention. The overall market sentiment index is currently in bearish zone.
Fundamental Analysis of Applovin Corp (APP)
Applovin Corp (APP) is in the Software & IT Services industry. Its latest annual revenue is $5.48B, ranking 57 in the industry. The net profit is $3.33B, ranking 18 in the industry. Company Profile
Over the past month, multiple analysts have rated the company as Buy, with an average price target of $500.96, a high of $790.00, and a low of $325.00.
More details about Applovin Corp (APP)
Company Specific Risks:
- AI Model Execution & Slower Performance Cycle: AppLovin faces severe scrutiny regarding the efficacy of its core AI ad-targeting engine, as lighter-than-expected model improvements and delayed algorithm releases have raised doubts among analysts over the durability of its quarterly self-learning growth.
- E-Commerce Ad Expansion Friction & Analyst Downgrades: Wall Street research, including downgrades from Wells Fargo and BofA Securities, highlighted that recent spikes in e-commerce Pixel installs represent a false start dominated by low-traffic merchant storefronts, undermining confidence in near-term revenue diversification beyond mobile gaming.
- Securities Class Actions & Unity Litigation Overhang: Multiple federal class-action lawsuits alleging securities fraud over AI-driven advertising claims, alongside an active legal dispute with rival Unity Software regarding ad data usage, continue to create persistent legal uncertainty and broad selling pressure.
- Compute Cost Escalation & EBITDA Compression: Accelerated expenses tied to AI model training and inference compute have driven operating costs higher, dampening adjusted EBITDA margins and triggering significant valuation multiple compression following recent top-line misses.
Recommended Articles


