

Oracle Stock Price Forecast: Reported New Round of Layoffs, Ellison Cancels Share Sale Plan, Will the Stock Stabilize at $142?

Source Tradingkey

TradingKey — On September 14 ET, Oracle (ORCL) shares dropped further to near $141, hitting a nearly two-week low.

Oracle has reportedly initiated a new round of layoffs, with the reduction rate in some teams potentially reaching double digits. The layoffs had been brewing internally, with the primary objective of lowering payroll costs to support the company's expanding investments in AI infrastructure. Prior to this round of job cuts, the company's workforce stood at approximately 141,000.

Among them, posts have begun appearing on social media platforms such as Reddit from users claiming to be affected by the latest round of layoffs. Last Friday, Oracle disclosed that it expanded its ongoing corporate restructuring plan, adding $700 million for employee severance and job cuts to address financial pressures resulting from heavy investments in AI infrastructure.

Notably, just days earlier, Oracle founder Larry Ellison canceled a plan to sell up to $7.5 billion worth of company stock only a day after publicly disclosing it. Oracle has yet to explain the cancellation of the stock sale plan, while Ellison still holds over 40% of the company's shares. According to The Wall Street Journal, the trading plan, known as a '10b5-1 plan,' was adopted on June 22 and was originally scheduled to expire on October 24.
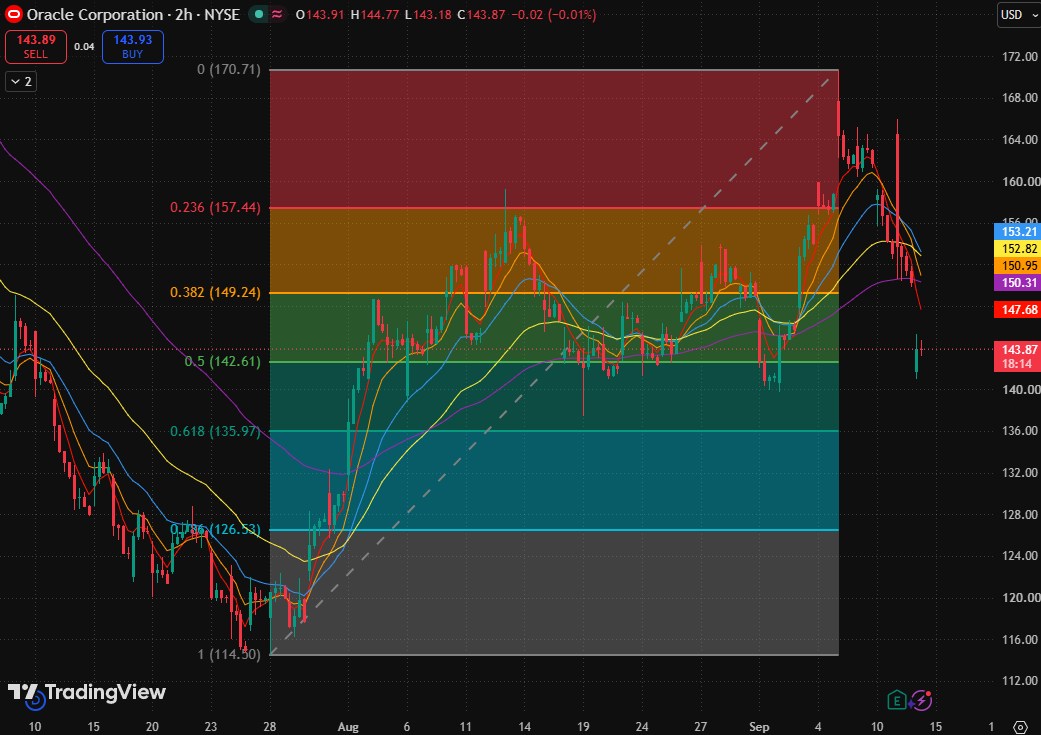
image-90735f2e36954aee91b1bc9d65785635

Oracle 2-hour stock price chart. Source: TradingView

Oracle surged to near $170 in early September, but pulled back after releasing its earnings report. The stock price has now fallen below its short-, medium-, and long-term moving averages, sitting just slightly above the 0.5 Fibonacci pullback level ($142.61). This indicates that the previous upward structure has cooled significantly, and the stock is currently undergoing a key support test following a sharp decline, rather than being in a rebound phase following a confirmed bottom.

Currently, the most critical defensive level is the 0.5 Fibonacci pullback level ($142.61). If subsequent 2-hour candlestick charts can stabilize above this level and successively reclaim the 5-day moving average ($147.72) and the 0.382 Fibonacci pullback level ($149.24), a technical recovery may begin to take shape.

Until the price reclaims the $149.24–$150.97 area, any bounce is more likely to be a weak counter-trend rally. Meanwhile, the $147.72–$153.23 range overlaps with the 5-day, 10-day, 20-day, 80-day, and 160-day moving averages, as well as the $149.24 pullback level, creating a heavy resistance zone against rebounds. If a bounce fails to reclaim this region, the current trend should still be viewed as weak consolidation following a drop.

If $142.61 fails to hold, the rally structure from $114.50 will be further damaged, potentially opening up downside space toward the 0.618 Fibonacci pullback level ($135.97).

Disclaimer: For information purposes only. Past performance is not indicative of future results.
placeholder
Gold Price Analysis Today: Gold Rebounds After 1.91% Drop as Yields Ease. Is $4,449 Next? Gold fell about 1.91% on August 18 before producing a strong bullish reaction from the 1-hour demand zone in early August 19 trading. RSI is recovering from oversold conditions, but Supertrend remains bearish as traders await the Fed minutes.
Author  Naoufal Seddik
Aug 19, Wed
Gold fell about 1.91% on August 18 before producing a strong bullish reaction from the 1-hour demand zone in early August 19 trading. RSI is recovering from oversold conditions, but Supertrend remains bearish as traders await the Fed minutes.
placeholder
Gold Price Analysis Today: Gold Gains 0.94% as Markets Expect Fed to Hold Rates, Can $4,449 Resistance Break? Gold gained 0.94% on August 17, closing near $4,417.30 as softer US data strengthened expectations for unchanged Fed rates in September. Gold remains bullish, with $4,449.730 resistance and $4,310.650 support in focus.
Author  Naoufal Seddik
Aug 18, Tue
Gold gained 0.94% on August 17, closing near $4,417.30 as softer US data strengthened expectations for unchanged Fed rates in September. Gold remains bullish, with $4,449.730 resistance and $4,310.650 support in focus.
placeholder
Gold Price Analysis Today: Gold Drops 1.32% Despite Lower Fed Rate-Hike Bets, Can $4,313 Support Hold? Gold fell 1.32% on August 13 after rising to $4,449.73, then reversing lower and closing near $4,349.918 below the $4,356.46 support. Softer US inflation data reduced Fed rate hike expectations, but selling pressure still dominated the session. Will $4,313 support hold?
Author  Naoufal Seddik
Aug 14, Fri
Gold fell 1.32% on August 13 after rising to $4,449.73, then reversing lower and closing near $4,349.918 below the $4,356.46 support. Softer US inflation data reduced Fed rate hike expectations, but selling pressure still dominated the session. Will $4,313 support hold?
placeholder
XAUUSD Gold Analysis: Gold Holds Above $4,350 Ahead of US Inflation Data Is $4,500 Next? Gold holds above $4,350 following weak US jobs data. As inflation reports approach and UBS eyes $5,000, can XAUUSD break resistance at $4,435 to rally toward $4,500?
Author  Naoufal Seddik
Aug 12, Wed
Gold holds above $4,350 following weak US jobs data. As inflation reports approach and UBS eyes $5,000, can XAUUSD break resistance at $4,435 to rally toward $4,500?
placeholder
Intel Price Forecast: Nvidia Picked Xeon 6, Invested $5B, Yet Analysts Still Trail INTCIntel Corporation (NASDAQ: INTC) sits at $140.05, holding firm on the ascending trendline within the 2H timeframe. The RSI indicator is currently reading 55.21, positioning it as neutral-
Author  TradingKey
Jul 02, Thu
Intel Corporation (NASDAQ: INTC) sits at $140.05, holding firm on the ascending trendline within the 2H timeframe. The RSI indicator is currently reading 55.21, positioning it as neutral-
goTop
quote