


USD/CAD Price Forecast: Buyers challenge 100-day SMA after double-bottom formation
- USD/CAD extends its advance as Fed rate hike bets lift the US Dollar to a nearly two-week high.
- The pair holds above the 200-day SMA but faces immediate resistance near the 100-day SMA.
- A potential double bottom near 1.3732-1.3759 suggests that the recent downtrend is losing momentum.
USD/CAD edges higher on Monday as Fed rate hike expectations lift the US Dollar (USD) to a nearly two-week high, while rising Oil prices provide little support to the commodity-linked Canadian Dollar (CAD). At the time of writing, the pair trades around 1.3898, remaining on the front foot for a fourth consecutive day.
Traders await the Fed’s interest rate decision on Wednesday, with the CME FedWatch Tool showing a 92.7% probability of a 25-basis-point increase, which would lift the federal funds target range to 3.75%-4.00%. A hawkish outcome could further widen the interest rate gap between the Fed and the Bank of Canada (BoC), which held its policy rate at 2.25% earlier this month, and support additional gains in USD/CAD.
Canada inflation steady as RBC sees BoC on hold until 2027
Economists at Royal Bank of Canada highlight that “Canadian inflation held at 3% year-over-year in August, unchanged from July,” with “underlying inflation pressures” described as having “remained comparatively contained.” In their view, the latest data “was broadly consistent with our base case that the BoC will hold interest rates through the remainder of 2026 before gradually raising rates in 2027 as the economy strengthens.”
Technical Analysis
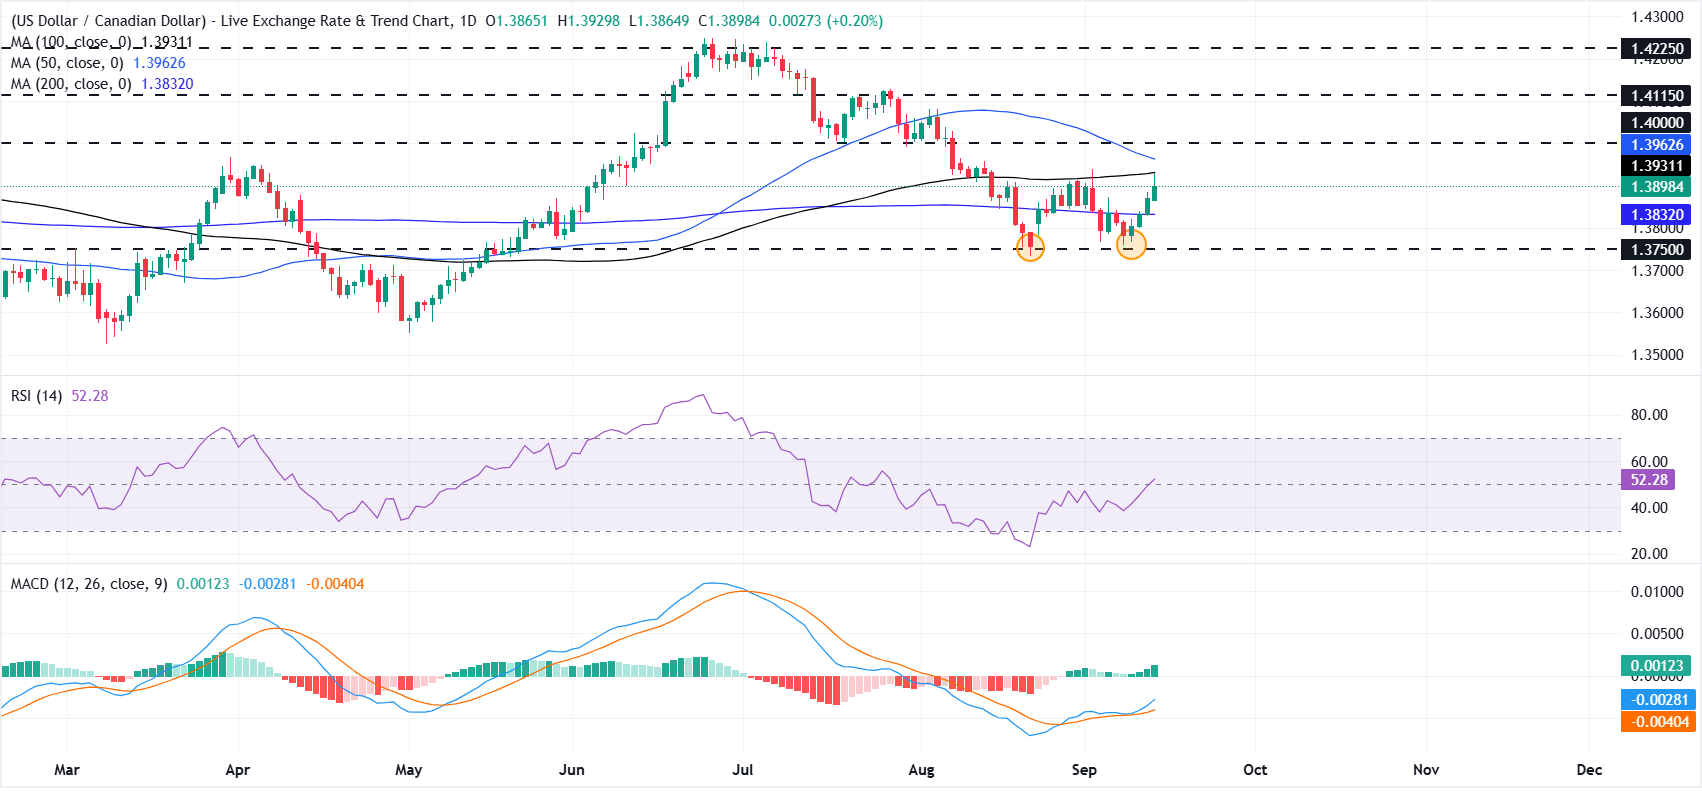
On the daily chart, USD/CAD has been trending lower since peaking near 1.4250 in late June, forming a sequence of lower highs and lower lows. However, the decline appears to have stalled after the pair bottomed at 1.3732 in August and found support again at 1.3759 earlier this month. The two lows point to a potential double-bottom formation, with the slightly higher September low suggesting that selling pressure is fading.
The pair is now holding above the 200-day Simple Moving Average (SMA) at 1.3832, while the 100-day SMA at 1.3931 caps the immediate upside. Momentum signals are also improving, with the Relative Strength Index (14) around 53 and the Moving Average Convergence Divergence (MACD) line holding above zero, hinting that selling pressure is fading but not yet strong enough to clear the overhead supply.
On the topside, initial resistance is seen at the 100-day SMA near 1.3931, followed by the 50-day SMA at 1.3963 and the 1.4000 psychological mark. A daily close above these levels would strengthen the double-bottom case and expose 1.4115, followed by 1.4225.
On the downside, the 200-day SMA near 1.3832 offers immediate support, ahead of 1.3759 and the August low at 1.3732. A break below this zone would invalidate the developing reversal pattern and revive the broader downtrend.
(The technical analysis of this story was written with the help of an AI tool. Know more.*)
Canadian Dollar Price Today
The table below shows the percentage change of Canadian Dollar (CAD) against listed major currencies today. Canadian Dollar was the strongest against the Japanese Yen.
| USD | EUR | GBP | JPY | CAD | AUD | NZD | CHF | |
|---|---|---|---|---|---|---|---|---|
| USD | 0.36% | 0.09% | 0.54% | 0.19% | 0.37% | 0.50% | 0.04% | |
| EUR | -0.36% | -0.24% | 0.16% | -0.19% | 0.00% | 0.16% | -0.32% | |
| GBP | -0.09% | 0.24% | 0.38% | 0.08% | 0.25% | 0.39% | -0.15% | |
| JPY | -0.54% | -0.16% | -0.38% | -0.35% | -0.15% | -0.04% | -0.54% | |
| CAD | -0.19% | 0.19% | -0.08% | 0.35% | 0.16% | 0.29% | -0.22% | |
| AUD | -0.37% | -0.00% | -0.25% | 0.15% | -0.16% | 0.14% | -0.41% | |
| NZD | -0.50% | -0.16% | -0.39% | 0.04% | -0.29% | -0.14% | -0.53% | |
| CHF | -0.04% | 0.32% | 0.15% | 0.54% | 0.22% | 0.41% | 0.53% |
The heat map shows percentage changes of major currencies against each other. The base currency is picked from the left column, while the quote currency is picked from the top row. For example, if you pick the Canadian Dollar from the left column and move along the horizontal line to the US Dollar, the percentage change displayed in the box will represent CAD (base)/USD (quote).
Recommended Articles


