


The Dollar Index climbs on Fed hike bets and stalls at its usual ceiling
- DXY climbs on Fed hike bets and stalls at its usual ceiling, near 99.50 and up 0.4%
- 10-year Treasury yield above 5% for the first time since October 2023, two days before the Fed
- Euro near 1.1500 at a one-month low, 57.6% of the basket, a week after the ECB hiked to 2.50%
The Dollar Index trades near 99.50, up 0.4% on the day, and it made the whole of that gain while America was asleep. A 5% Treasury yield sounds like the best thing that could happen to the Dollar, and New York has spent the morning selling it.
That is because a currency is paid for the gap between its interest rates and everyone else's, not for the level, and the gap isn't widening: the European Central Bank (ECB) raised rates last week, the Bank of Japan (BoJ) does it on Friday, and the Bank of England (BoE) has a move priced for November.
A 5% yield isn't the gift it looks like
The Dollar climbed half a point between the Sunday open in Asia and the London morning, from just above 99.05 to near 99.60 by 08:00 GMT, added a further 0.16 into the New York stock market open, and has given the New York part back since. The high came at 14:00 GMT, the same hour the 10-year yield crossed 5%. That is the moment the Dollar stopped going up.
The reason is what is pushing the yield. Investors aren't paying up for American bonds because the economy is booming. They are demanding more to hold them, because the government is borrowing more, companies are borrowing hundreds of billions to build artificial intelligence (AI) data centres, and Crude Oil above $103 a barrel keeps inflation above target.
Friday's expanded Treasury buyback, the operation designed to hold long-term yields down, bought $5.2 billion against a $6 billion cap, and the 10-year went up anyway. There is a difference between the world paying more to own American bonds and America paying more to borrow. The Dollar spent New York's morning working out which one this is.
Three of the six currencies in the basket have a central bank moving this month
The Euro is 57.6% of the index, so the Dollar Index is mostly the Euro upside down. The Euro trades near 1.1500, its lowest since mid-August and down about half a percent today, and that is where the Dollar's gain came from. The ECB raised its rate to 2.50% last Thursday, as all 65 economists in one poll expected, and a quarter-point from the Fed on Wednesday against a quarter-point from the ECB leaves the gap between the two exactly where it was.
The Yen is 13.6% of the basket and the BoJ is expected to lift its rate to 1.25% on Friday. The Yen is up 4% this month, Tokyo has spent $96.4 billion buying it, and speculators hold more bets on it rising than falling for the first time since February.
The Pound is 11.9%, and the BoE holds at 3.75% on Thursday with a 30% chance of a hike and a November move almost fully priced. The Dollar's own hike is priced at 90%. It is the only one of the four still being called a bet.
Crude Oil above $103 ought to help too, because America sells energy abroad and Europe and Japan buy it, so every extra dollar on the barrel moves money from the Euro's economy to the Dollar's. Since late August the barrel has gone from the low $80s to above $103 and the Dollar Index from around 99.15 to near 99.50. The same barrel is the reason the ECB and the BoJ are raising rates, and a hike abroad cancels the energy dividend.
Wednesday decides the gap, not the hike
The Fed decides at 18:00 GMT on Wednesday, and futures put roughly 90% on a quarter-point increase that would lift the Fed's rate from 3.50-3.75% to 3.75-4.00%. The hike itself is in the price. What isn't is the chart of rate projections the Fed publishes with it, which in June showed 3.8% for the end of this year, 3.6% for next year and 3.4% for 2028, a hike now and cuts later.
If Wednesday's version shows more hikes, the gap with Europe and Japan widens next year and the Dollar gets a reason to leave its box. If it repeats June, the Fed hikes once while the ECB and BoJ keep going, and the gap narrows.
August retail sales land first, at 12:30 GMT on Wednesday, with the forecast at 0.9% after a 0.6% fall. Retail sales are counted in dollars, so pricier gasoline flatters the headline, and the control group, which strips out fuel, cars and building materials, was last at a 0.4% fall and tells you which.
British inflation for August arrives Wednesday morning, a day before the BoE decides at 11:00 GMT on Thursday, and the BoJ follows on Friday. Jobless claims are seen at 205K on Thursday at 12:30 GMT, and a Fed governor speaks at 07:30 GMT on Friday.
Levels and bias
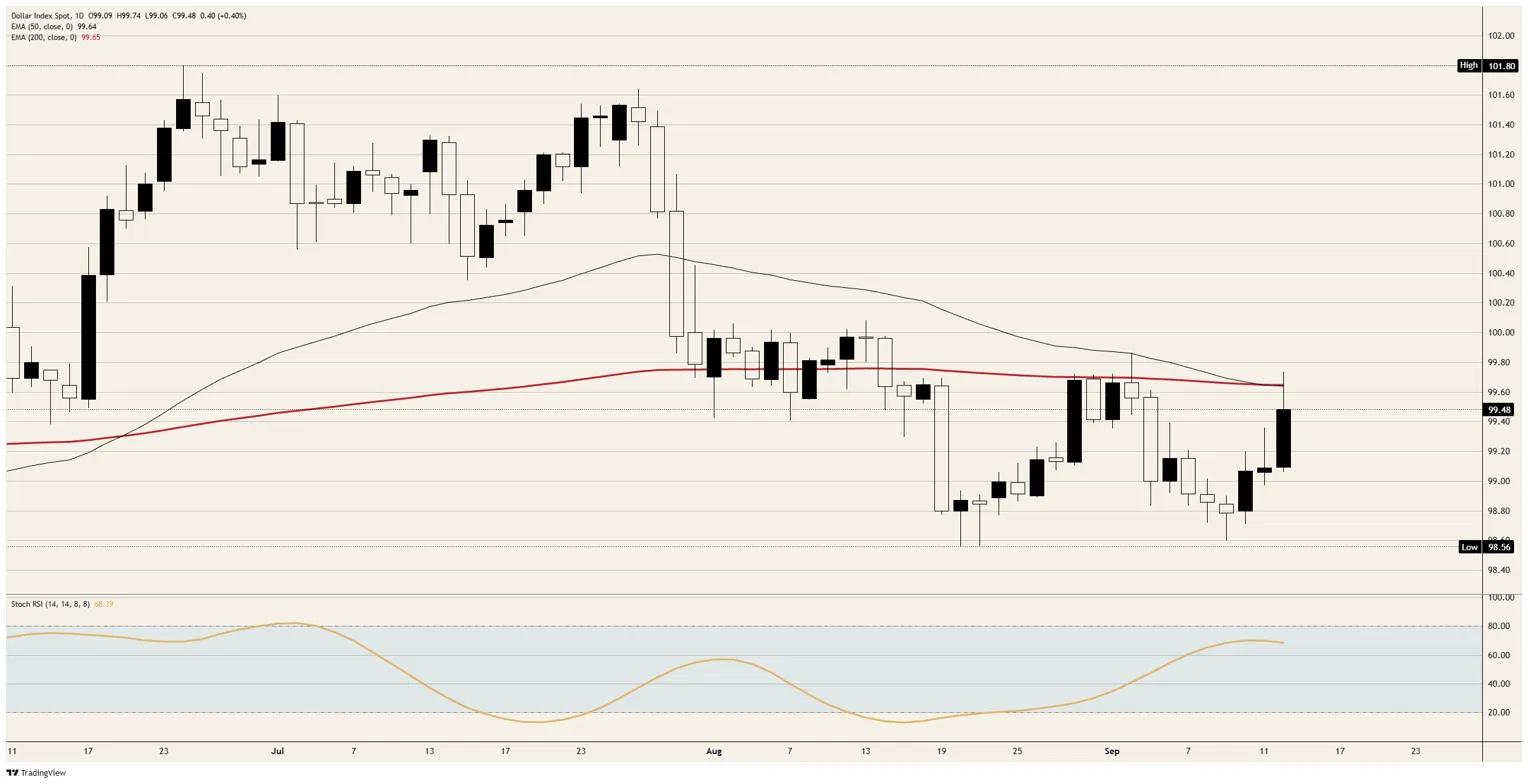
Resistance: Today's high just under 99.75 is the ceiling, and the two long-run averages, the 50-day and 200-day Exponential Moving Averages (EMA), sit on top of each other near 99.65 just beneath it. The index has been turned back from that line five times since August 28, and only the September 2 high just short of 99.90 sits above.
Support: The 99.05 area where the week began is the first floor. Under it sits the 98.80 area where most of last week traded, then the August low near 98.55.
Bias: Bearish while 99.75 caps, with the 99.05 area the first objective and 98.80 behind it. The daily Stochastic Relative Strength Index (Stoch RSI), a momentum gauge, reads near 68 and has been flat for four sessions after climbing from 16 on August 19, so the rally has already spent its momentum without leaving the box. A daily close above 99.75 voids the case and puts the September 2 high in play.
DXY daily chart
US Dollar FAQs
The US Dollar (USD) is the official currency of the United States of America, and the ‘de facto’ currency of a significant number of other countries where it is found in circulation alongside local notes. It is the most heavily traded currency in the world, accounting for over 88% of all global foreign exchange turnover, or an average of $6.6 trillion in transactions per day, according to data from 2022. Following the second world war, the USD took over from the British Pound as the world’s reserve currency. For most of its history, the US Dollar was backed by Gold, until the Bretton Woods Agreement in 1971 when the Gold Standard went away.
The most important single factor impacting on the value of the US Dollar is monetary policy, which is shaped by the Federal Reserve (Fed). The Fed has two mandates: to achieve price stability (control inflation) and foster full employment. Its primary tool to achieve these two goals is by adjusting interest rates. When prices are rising too quickly and inflation is above the Fed’s 2% target, the Fed will raise rates, which helps the USD value. When inflation falls below 2% or the Unemployment Rate is too high, the Fed may lower interest rates, which weighs on the Greenback.
In extreme situations, the Federal Reserve can also print more Dollars and enact quantitative easing (QE). QE is the process by which the Fed substantially increases the flow of credit in a stuck financial system. It is a non-standard policy measure used when credit has dried up because banks will not lend to each other (out of the fear of counterparty default). It is a last resort when simply lowering interest rates is unlikely to achieve the necessary result. It was the Fed’s weapon of choice to combat the credit crunch that occurred during the Great Financial Crisis in 2008. It involves the Fed printing more Dollars and using them to buy US government bonds predominantly from financial institutions. QE usually leads to a weaker US Dollar.
Quantitative tightening (QT) is the reverse process whereby the Federal Reserve stops buying bonds from financial institutions and does not reinvest the principal from the bonds it holds maturing in new purchases. It is usually positive for the US Dollar.
Recommended Articles


