


SpaceX Stock Price Forecast: Nasdaq 100 Rebalancing May Trigger $12.4 Billion Passive Buying, Shares Could Rise to $161
TradingKey - On September 8 Eastern Time, SpaceX (SPCX)'s stock price broke through its intermediate high of $150, with technicals showing SpaceX's stock price is expected to break further above $161.
Nasdaq is expected to announce its rebalancing results after the U.S. market close this Friday, with changes officially taking effect on September 21. It is reported that when determining a company's index weight, Nasdaq calculates based on its market capitalization and compares its total shares outstanding with three times its free-float shares, taking the lower of the two figures.
For stocks with a low proportion of free-float shares, their full market capitalization is not used to calculate index weight. Restricted by lock-up periods, SpaceX's current free-float ratio is relatively low, leaving its weight in the Nasdaq 100 Index at just 1.25%, ranking 19th.
J.P. Morgan Securities strategist Min Moon and his team estimate that SpaceX's weight in the Nasdaq 100 Index could rise to 1.51% after the rebalancing, which would lead index funds and ETFs tracking the index to net buy approximately $12.4 billion worth of SpaceX stock.
Meanwhile, Pivotal Research initiated coverage on SpaceX with a "Buy" rating and a target price of $220. Based on the September 4 closing price of $147.95, this target price implies an upside potential of approximately 49%.
Pivotal analyst Jeffrey Wlodarczak stated that SpaceX's current valuation of approximately $2 trillion depends largely on whether Starship can solve the key engineering challenge of reusability. The firm expects each Starship to complete about 20 to 50 flights, with maintenance and redeployment completed at low cost and in a short timeframe between launches.
Wlodarczak called this a "single but massive engineering bottleneck." If SpaceX can achieve high-frequency, low-cost reusability, launch costs are expected to drop significantly, potentially approaching terrestrial freight levels. At that point, the company could not only expand its Starlink satellite network faster, but also open up business opportunities in orbital AI data centers, space manufacturing, Earth observation, defense contracts, and point-to-point space passenger transport.
Pivotal also believes that Starlink is expected to capture a share of the roughly $1.7 trillion terrestrial and wireless communications market. As launch costs decline, SpaceX will have greater flexibility to deploy satellites, build orbital computing infrastructure, and expand into more commercial projects reliant on high-frequency launches.
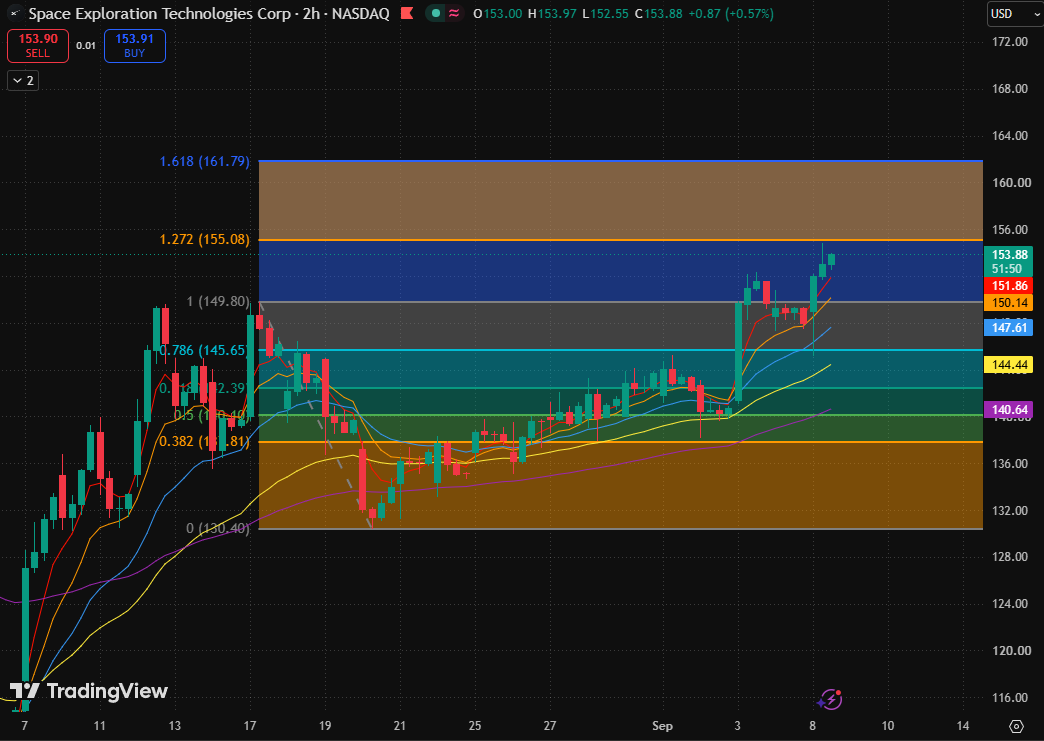
SpaceX daily chart, Source: TradingView
SpaceX's stock price has broken above its intermediate high ($149.80) and is trading above all moving averages, approaching the 1.272 Fibonacci extension level ($155.08). The current focus is to confirm whether $155.08 can be effectively broken.
Previously, the stock price successively reclaimed the 0.786 Fibonacci retracement level ($145.65) and the 1 Fibonacci retracement level ($149.80). Following the breakout above $149.80, a brief pull-back occurred, but the price did not fall below this level before turning upward again, indicating that the breakout above the previous high currently remains valid.
The current price is above the 5-day, 10-day, 20-day, 80-day, and 160-day moving averages. The five moving averages are aligned downward in order from shortest to longest timeframe, placing the 2-hour chart in a clear bullish trend.
The current price is only about 1% away from the 1.272 Fibonacci extension level ($155.08), having entered an extension resistance zone. If subsequent 2-hour candlesticks can effectively hold above $155.08 and convert it into support during a pull-back, upside room could further point to the 1.618 Fibonacci extension level ($161.79).
If the price repeatedly surges and retreats near $155.08, it would indicate that selling pressure at the extension level is beginning to be released, and the trend may first pull back to test the 5-day and 10-day moving averages as well as the $149.80 breakout level.
If the $145.65–$144.42 support zone is lost further, it would mean that the higher-highs and higher-lows structure following this breakout is significantly damaged, and the pullback could extend to the 0.618 Fibonacci retracement level ($142.39) and the 160-day moving average ($140.63).
Recommended Articles


