


Dell Stock Surges 16% on $95B AI Backlog: Can DELL Break $500?
TradingKey - Dell starts the month closing in on $492.31, representing over 15.8% growth from the September 1 close of $425.00, with the September 2 session closing at $492.20. This indicates that the post-earnings gap made up the pre-report breakdown and even broke $473.36 resistance. Along with this, the positive sentiment and breakout excited the bulls as the stock surged on the back of new and historically significant AI orders, a backlog of $95 billion, and an even more crucial upgrade to its full-year guidance. Now, the real question is, can this stock breakout the resistance of $500-$513.09?
Q2 Results Reset Dell's Growth Expectations
Dell's second-quarter results reported massive year over year growth of 58% with revenue coming in at $47.0 billion, compared to Wall Street's expectations of $44.9 billion. From a GAAP and non-GAAP perspective EPS came in at $6.34 and $7.04, respectively.
The operating income of Dell's flagship Infrastructure Services and Solutions (ISG) division surged 225% to $4.8 billion. This division, which includes AI servers, also refers to something of interest to analysts and bears – profit margins.AI servers' profit margins coupled with efficient, disciplined pricing mean that storage solutions may also be operating at better margins.
$60.9 Billion of AI Orders Drives the Repricing
The major AI server orders in the second quarter totaled $60.9 billion, with Dell even posting a record backlog of $95 billion. This reflects quite a change from the fiscal 2026 revenue of $113.5 billion. The backlog does not translate to immediate revenue. However, it does provide great visibility to future revenue if the power and components are available to meet the customer deployment demand.
FY2027 Guidance Jumps Again
Dell Technologies now anticipates $74 billion of fiscal year 2027 revenue from AI-oriented Servers, an increase from $60 billion. The company has revised expectations upwards from $167 billion of revenue to $192 billion, and pushed non-GAAP EPS from an expected range of $17.90 to the new level of $25.50.
For Fiscal Q3, the company expects around $49 billion of revenue and non-GAAP EPS of $6.50. Expanding the opportunity beyond management's expectations (which was set only a quarter ago) has led Dell to update these results.
Growth Is Broadening Beyond AI Servers
The launch of Dell Technologies products has been increasing. Revenue for the Infrastructure Solutions Group increased by 89 percent over the previous year, totaling $31.8 billion. Traditional Server and Networking Products revenue totaled $10.5 billion with a growth rate of 122 percent. Storage Products revenue increased by 26 percent and totaled $4.9 billion.
The Client Solutions Group has also recorded positive revenue growth of 20 percent at $15 billion. Even more positive within this revenue growth was the increase experienced in the commercial client portion of the group, at a record setting $13.2 billion, resulting in a growth of 22 percent.
Supply and Power Are the Main Risks
While demand for the products remains, efficient backlog conversion and contract profitability are the largest concerns. Dell Technologies relies on Nvidia's accelerators, memory systems, networking, and liquid cooling, so brief gaps in the revenue recognition process may be caused by shortages in these components. Physical power is also a concern. Large AI systems also create a need for Datacenters with grid power and cooling capacity, and a backlog conversion lag may occur if customers place orders for servers at a greater rate than utilities provide connection to the new Datacenters.
Dell Technical Analysis: $500-$513 Is the Next Test
The 1 Hour Chart has Dell at around $492.31 compared to the current market at around $492.31. Buyers have taken control of the moving average zone at around $454.44 and have successfully broken the former $473.36 resistance level, defending $425.12.
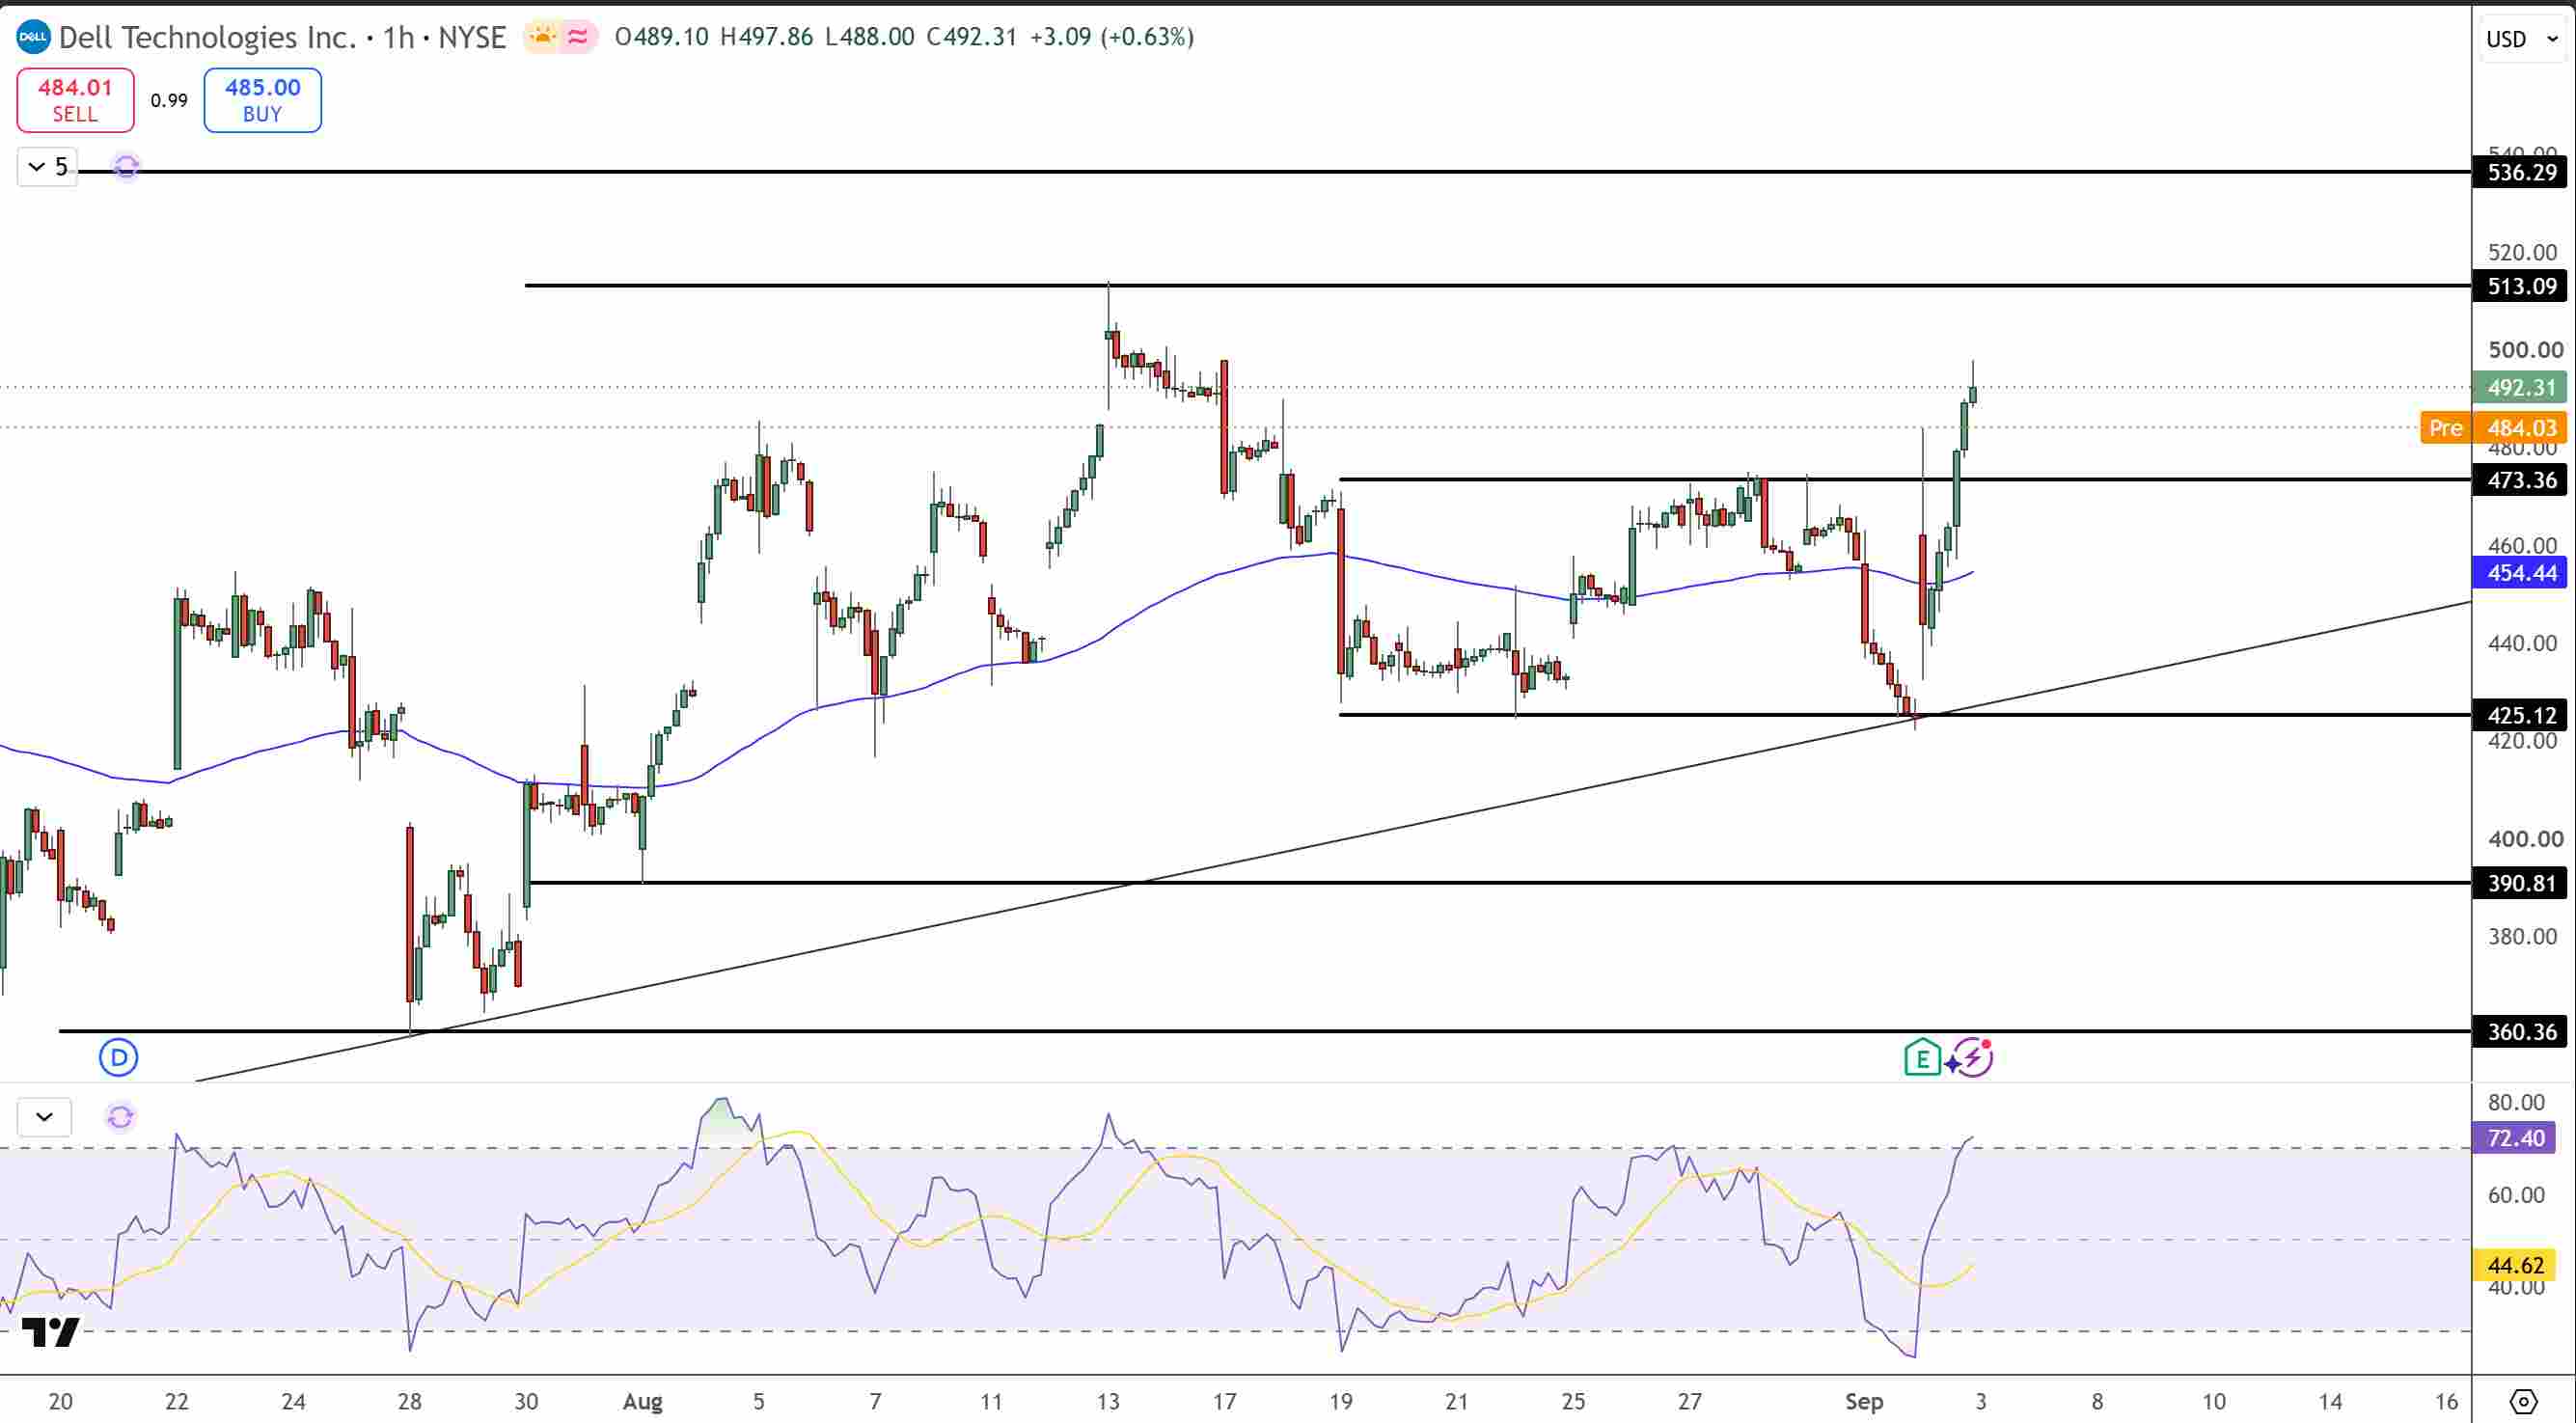
Dell Stock Price Chart - Source: Tradingview
The next Defined resistance is at $500 and then at the major horizontal block at $513.09. Above $513.09, and more solidly beyond it, would create even more of a continuation structure , with the potential next target at $536.29.
RSI at 72 has moved above the 70 overbought level, therefore a consolidation move would be normal. A break below the new first major support zone of $473.36 would indicate a deeper pullback to the $454.44 support level.
Key Levels
· Current price is around $492.31
· Breakout support is at around $473.36
· Secondary support is at $454.44
· Psychological resistance is at $500
· Major resistance is at $513.09
· Higher target is at $536.29
· RSI is at around 72 (overbought)
Why is Dell stock rallying?
Strong quarterly revenue of $47.0 billion, large AI-server orders of $60.9 billion, and a $95 billion AI-server backlog suggest that Dell is being repriced.
What level confirms another DELL breakout?
A sustained move above $513.09 would confirm continuation beyond the current earnings range and suggest a potential move to $536.29.
Bottom Line
Dell's September 2 rally has legitimate support from more significant fundamental changes. AI demand, traditional infrastructure investments, and demand growth along with improvement in profitability and revenue create a positive environment. -the stock's 16% move made it technically extended, but the breakout remains intact while $473.36 holds. A sustained break above $500-$513.09 keeps the move toward $536.29 active.
Recommended Articles


