


NZD/USD (NZDUSD) Surges on Sep 3: What Are the Key Reasons?
NZD/USD (NZDUSD) is up 0.50% at Sep 3 09:00(ET), now at $0.58798, with a 7-day down of 1.14%.
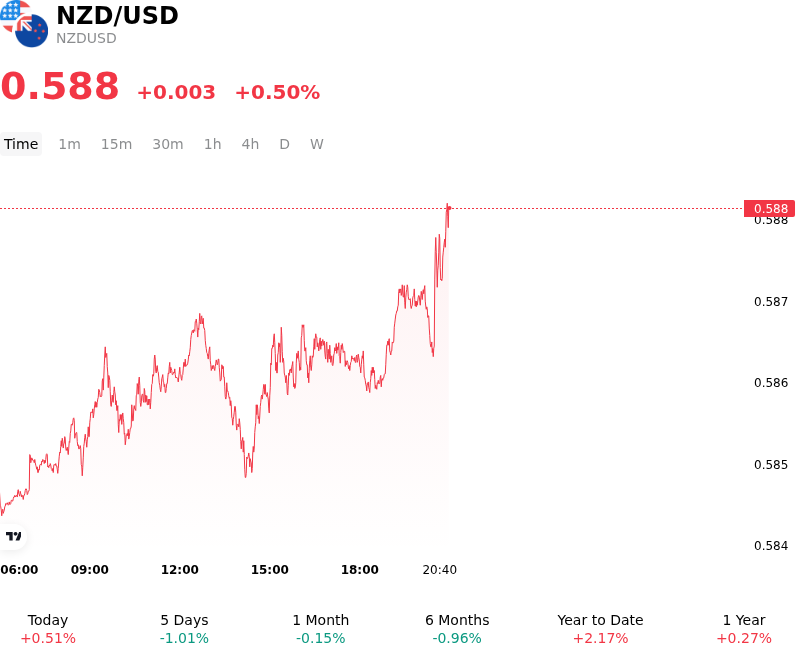
What is driving NZD/USD (NZDUSD)’s stock price up today?
The advance in NZD/USD was primarily driven by a resurgence in demand for China-sensitive proxy currencies following stronger-than-expected economic data out of China, combined with broad-based weakness in the US Dollar ahead of key labor market figures. As New Zealand's largest trading partner, signs of economic stabilization in China provided a strong tailwind for the Kiwi dollar, prompting capital inflows into high-beta commodity currencies.
Chinese services sector activity expanded at a faster-than-expected pace, beating consensus expectations and reinforcing optimism surrounding regional trade dynamics. This positive data impulse altered near-term expectations for New Zealand's external growth outlook, encouraging market participants to rebuild long Kiwi exposure following a period of underperformance.
Concurrently, the US Dollar faced downside pressure across major currency pairs after soft private labor market data pointed to cooling employment conditions in the United States. The unexpected slowdown in private payroll creation weighed on US Treasury yields and greenback demand as investors calibrated expectations ahead of official nonfarm payroll figures. This shift in US rate expectations narrowed yield differentials to the benefit of the base currency.
From a policy perspective, the move also reflects market digestion of the Reserve Bank of New Zealand's recent monetary policy adjustments. While the central bank signaled a measured approach to further policy tightening, short-term positioning had grown stretched following prior downside momentum. Technical short-covering and dip-buying near key support levels accelerated the intraday rebound as global risk sentiment stabilized.
Overall, the upward trajectory appears to be an event-driven corrective bounce supported by improving Asian regional data and soft US macro releases. Institutional investors will continue monitoring US employment metrics and the Chinese growth trajectory to evaluate whether this movement can develop into a broader structural uptrend or remain confined to a tactical retracement.
Technical Analysis of NZD/USD (NZDUSD)
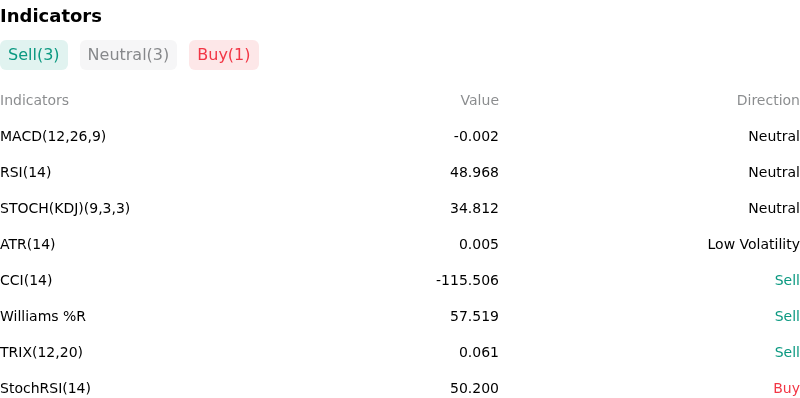
Technically, NZD/USD (NZDUSD) shows a MACD (12,26,9) value of -0.002, indicating a neutral signal. The RSI at 48.354 suggests neutral condition and the Williams %R at 59.613 suggests sell condition. Please monitor closely.
More details about NZD/USD (NZDUSD)
Recent Events and Risks:
- Dovish RBNZ Guidance and Rate Expectation Repricing: The Reserve Bank of New Zealand delivered a 25 bps rate hike to 2.75% but signaled a cautious stance, indicating that the move reduces the need for aggressive future tightening; this cautious guidance disappointed hawkish market projections and triggered institutional unwinding of Kiwi long positions.
- US Dollar Yield Spread Disadvantage: Resilient U.S. economic indicators and hawkish Federal Reserve commentary continue to bolster U.S. Treasury yields, widening the yield differential against New Zealand fixed income and placing persistent downward pressure on the NZD/USD exchange rate.
- Domestic Economic Fragility and Labor Market Weakness: New Zealand's domestic recovery remains sluggish and uneven, constrained by weak consumer spending, depressed real disposable incomes from elevated import and energy costs, and an elevated unemployment rate of 5.6%.
- China Growth Headwinds and Geopolitical Risk Aversion: Sluggish economic momentum in China—New Zealand's top export destination—combined with Middle East geopolitical instability has weighed on global risk sentiment, dampening demand for risk-sensitive commodity currencies like the NZD in favor of safe-haven U.S. Dollar flows.
Recommended Articles


