

SanDisk Stock Price Prediction: Head-and-Shoulders Bottom Pattern Forms, Stock Expected to Return to $2,000

Source Tradingkey

TradingKey - As of August 31, Eastern Time, SanDisk (SNDK) stock rebounded strongly, closing up 5.5% for the day and reaching an intraday high of $1,572.69, with a trading volume of approximately 23.38 million shares, significantly higher than recent average levels. However, compared with the high of $2,354.39 reached earlier this year, SanDisk is still down about 33% from its peak, with the stock currently in a consolidation and recovery phase following the previous sharp rally.

SanDisk's fundamentals remain supported by rising NAND prices and AI data center demand. The company's latest quarterly revenue reached $8.965 billion, up 51% quarter-over-quarter, with data center revenue reaching $2.977 billion, up 103% quarter-over-quarter; full-year revenue for fiscal year 2026 grew 175% year-over-year. The company also further expanded its share repurchase program and expects next quarter's revenue to reach $10.3 billion to $10.8 billion.
sndk-179a315d8cb0472e9aa16f4f6fee1895

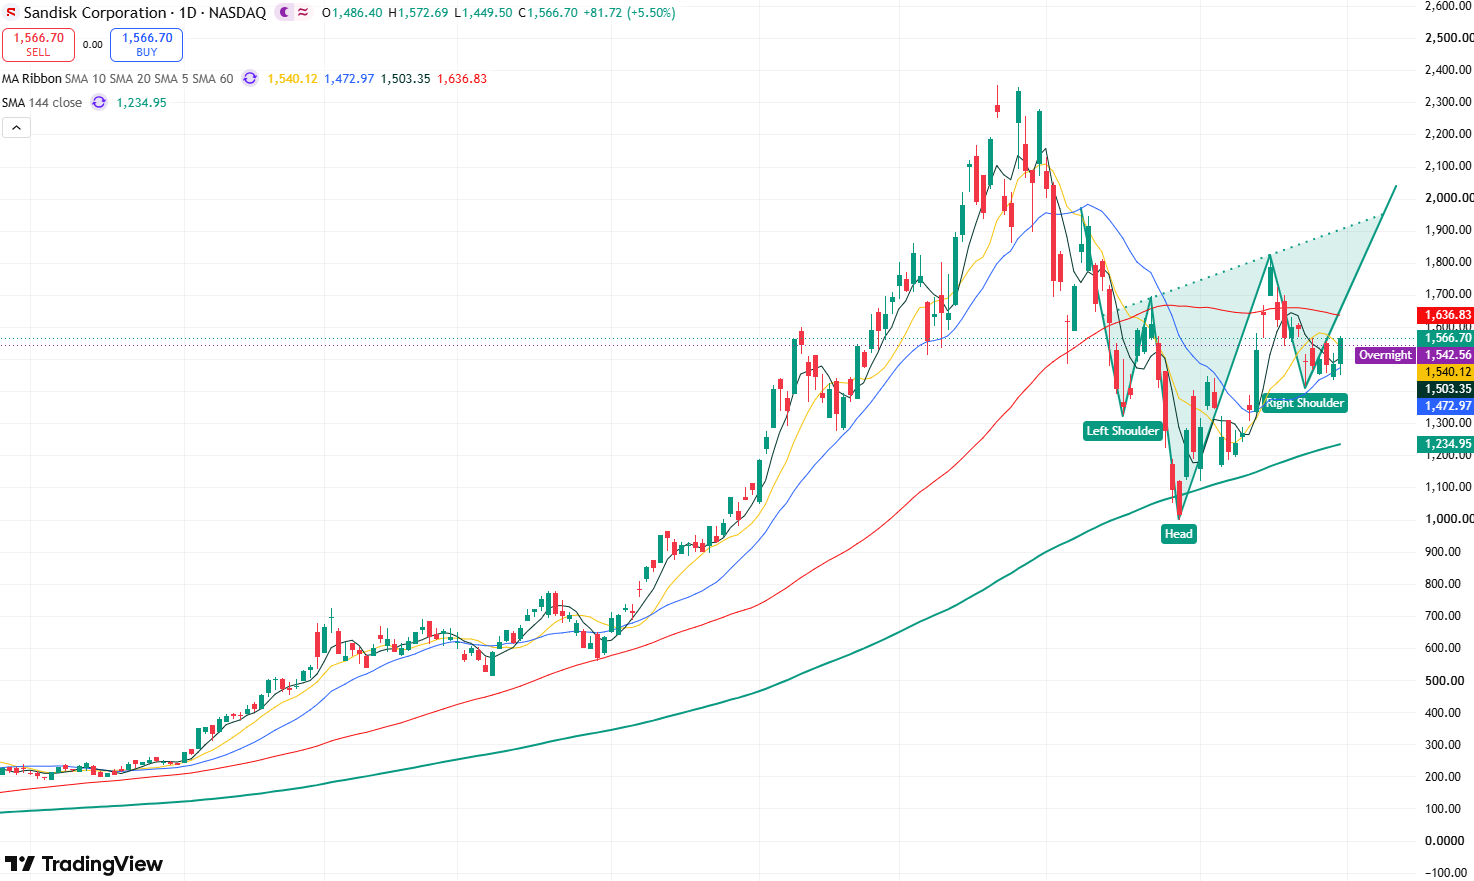
SanDisk stock daily chart, Source: TradingView

Looking at the daily chart of SanDisk's stock price, SanDisk experienced a sharp pullback after surging above $2,300 earlier this year, but the stock gradually stabilized after bottoming near $1,000 and is currently forming a clear head-and-shoulders bottom pattern. The left shoulder is located near $1,300, the head low is close to $1,000, and the right shoulder is forming near $1,400, indicating that the medium-term bottoming structure is improving.

Currently, as the head-and-shoulders bottom pattern takes shape, market bullish momentum has strengthened significantly. The primary upside target for the stock will be testing the rebound high of $1,952.59 set on July 9. If it breaks through this level, the stock will further challenge the $2,000 mark and may even test the historical high of $2,354.39.

On the downside, the primary initial support level to watch is $1,400. If this level fails to hold, the stock may test the $1,300 mark, and if it continues to fall, the stock could drop back toward $1,000.

Disclaimer: For information purposes only. Past performance is not indicative of future results.
placeholder
XRP Price Prediction for July 2026: Can Buyers Finally Break the Downtrend?XRP (XRP) price trades near $1.05, caught between a year-long downtrend and a sudden burst of buying.July has historically rewarded XRP holders. This year the month arrives with on-chain accumulation
Author  Beincrypto
Jun 30, Tue
XRP (XRP) price trades near $1.05, caught between a year-long downtrend and a sudden burst of buying.July has historically rewarded XRP holders. This year the month arrives with on-chain accumulation
placeholder
What to Expect From Ethereum (ETH) in July 2026Ethereum (ETH) enters July 2026 trading near $1,570, close to multi-month lows, after recording its first run of three consecutive red quarterly candles in its history.On-chain data and price charts n
Author  Beincrypto
Jul 01, Wed
Ethereum (ETH) enters July 2026 trading near $1,570, close to multi-month lows, after recording its first run of three consecutive red quarterly candles in its history.On-chain data and price charts n
placeholder
XAUUSD Gold Analysis: Gold Holds Above $4,350 Ahead of US Inflation Data Is $4,500 Next? Gold holds above $4,350 following weak US jobs data. As inflation reports approach and UBS eyes $5,000, can XAUUSD break resistance at $4,435 to rally toward $4,500?
Author  Naoufal Seddik
Aug 12, Wed
Gold holds above $4,350 following weak US jobs data. As inflation reports approach and UBS eyes $5,000, can XAUUSD break resistance at $4,435 to rally toward $4,500?
placeholder
Gold Price Analysis Today: Gold Gains 0.94% as Markets Expect Fed to Hold Rates, Can $4,449 Resistance Break? Gold gained 0.94% on August 17, closing near $4,417.30 as softer US data strengthened expectations for unchanged Fed rates in September. Gold remains bullish, with $4,449.730 resistance and $4,310.650 support in focus.
Author  Naoufal Seddik
Aug 18, Tue
Gold gained 0.94% on August 17, closing near $4,417.30 as softer US data strengthened expectations for unchanged Fed rates in September. Gold remains bullish, with $4,449.730 resistance and $4,310.650 support in focus.
placeholder
Gold Price Analysis Today: Gold Rebounds After 1.91% Drop as Yields Ease. Is $4,449 Next? Gold fell about 1.91% on August 18 before producing a strong bullish reaction from the 1-hour demand zone in early August 19 trading. RSI is recovering from oversold conditions, but Supertrend remains bearish as traders await the Fed minutes.
Author  Naoufal Seddik
Aug 19, Wed
Gold fell about 1.91% on August 18 before producing a strong bullish reaction from the 1-hour demand zone in early August 19 trading. RSI is recovering from oversold conditions, but Supertrend remains bearish as traders await the Fed minutes.
goTop
quote