


If a Stock Market Crash Is Coming, History Says There's a Major Silver Lining for Investors
Key Points
Multiple market metrics suggest that many stocks could be overvalued right now.
With the right strategy, bear markets can be fantastic wealth-building opportunities.
Choosing the right stocks is more important than ever.
- 10 stocks we like better than S&P 500 Index ›
After several years of record-breaking growth, major market indexes have wavered. The S&P 500 (SNPINDEX: ^GSPC), Dow Jones Industrial Average (DJINDICES: ^DJI), and Nasdaq Composite (NASDAQINDEX: ^IXIC) have all slipped, down by roughly 2%, 1%, and 3%, respectively, over the past two weeks.
Investors are also feeling uncertain about the future. Nearly 40% of investors expect the market to fall over the next six months, according to the latest weekly survey from the American Association of Individual Investors, while around 35% are bullish and 25% are neutral.
Missed Nvidia in 2009? This Rare Signal Is Flashing Again. In 2009, a "Double Down" signal flashed for a little-known chipmaker called Nvidia. For the first time in years, that same "Total Conviction" signal is flashing for a company 1/100th the size of Nvidia. Continue »
There are several factors fueling the recent wave of uncertainty, from volatility within the tech sector to shaky earnings reports to ambiguity from the Federal Reserve about future interest rate decisions. If these factors create a perfect storm for a market downturn, history still has good news for investors.

Image source: Getty Images.
Will the stock market crash in 2026?
Stock prices can't continue climbing forever, and there are already warning signs that the market may be overvalued.
The Buffett indicator, for example, measures the relationship between the total value of U.S. stocks and GDP. A higher percentage suggests the market is more richly valued, and Warren Buffett -- who popularized the metric in 2001 -- noted that when it nears 200%, investors are "playing with fire." As of August 2026, the Buffett indicator sits at a record high of nearly 238%.
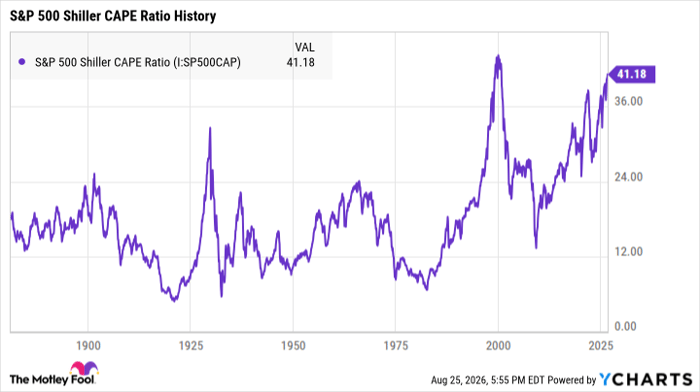
Another market indicator sounding the alarm is the S&P 500 Shiller Cyclically Adjusted Price-to-Earnings (CAPE) ratio. While this metric also tracks market valuations, it does so by measuring the S&P 500's 10-year inflation-adjusted earnings.
S&P 500 Shiller CAPE Ratio data by YCharts
The CAPE ratio has a long-term average of around 17, dating back to the 1870s. During the dot-com bubble, as company valuations skyrocketed, the ratio peaked at just over 44. As of this writing, it's at just over 41 -- its second highest level in history.
Historically, stock prices tend to fall in the years following a spike in the CAPE ratio. It happened after the Great Depression, when it peaked at 31 in the summer of 1929, and it happened again after the dot-com bubble.
The silver lining of a bear market or recession
Bear markets are daunting even for the most seasoned investors, but the silver lining is that they're also fantastic buying opportunities. With valuations soaring, the market is pricier than it's been in decades. If we face a pullback, it can give investors a chance to load up on quality stocks at a fraction of the price.
If the S&P 500 falls by, say, 20% during the next bear market, that won't be great for investors' current portfolio values. However, it also means you'll be able to snag an S&P 500 ETF at a 20% discount. Then, when the market inevitably bounces back, you'll be well-positioned for lucrative earnings.
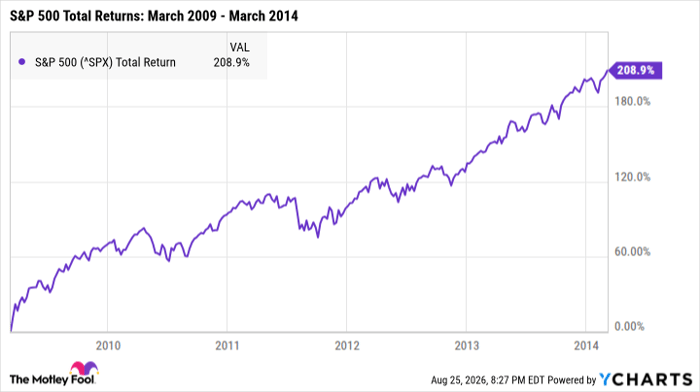
For example, say you'd invested in an S&P 500 ETF in March 2009, at the lowest point of the Great Recession. The index had lost more than half its value since October 2007, and there was no telling at the time how much longer the bear market would last. However, within just five years, you'd have more than tripled your money.
^SPX data by YCharts
The caveat is that not all investments will recover from a bear market. During the dot-com bubble, for instance, many high-flying tech stocks broke records before filing for bankruptcy just a few years later.
When you're researching stocks, a company's fundamentals are key. Does it have a sustainable business model? What about a competitive advantage that can stand the test of time? Is it in the hands of a capable leadership team with a history of sound decisions? All of these factors will influence how well a stock navigates a downturn.
It's impossible to say precisely when the next bear market will begin, but it's coming eventually. The investors who reap the greatest rewards will be those who take advantage of the buying opportunity.
Should you buy stock in S&P 500 Index right now?
Before you buy stock in S&P 500 Index, consider this:
The Motley Fool Stock Advisor analyst team just identified what they believe are the 10 best stocks for investors to buy now… and S&P 500 Index wasn’t one of them. The 10 stocks that made the cut could produce monster returns in the coming years.
Consider when Netflix made this list on December 17, 2004... if you invested $1,000 at the time of our recommendation, you’d have $439,308!* Or when Nvidia made this list on April 15, 2005... if you invested $1,000 at the time of our recommendation, you’d have $1,286,826!*
Now, it’s worth noting Stock Advisor’s total average return is 964% — a market-crushing outperformance compared to 212% for the S&P 500. Don't miss the latest top 10 list, available with Stock Advisor, and join an investing community built by individual investors for individual investors.
See the 10 stocks »
*Stock Advisor returns as of August 27, 2026.
Katie Brockman has no position in any of the stocks mentioned. The Motley Fool has no position in any of the stocks mentioned. The Motley Fool has a disclosure policy.
Recommended Articles


