


Gold edges higher as falling yields offset Fed hawkish talk
- Gold edges higher as falling yields support bullion above $4,600.
- Fed hawks stress sticky inflation, but Gold barely reacts.
- Warsh's speech and sentiment data could reset Fed expectations.
Gold (XAU/USD) drifts higher on Thursday, up 0.25% after US jobs data was solid, while the trade deficit widened the most since US President Donald Trump's “Liberation Day.” Also, falling US Treasury yields and muted price action as investors eye Federal Reserve (Fed) Chair Kevin Warsh's speech keep the precious metal near familiar levels. XAU/USD trades at $4,610 at the time of writing.
XAU/USD steadies above $4,600 as traders await Warsh’s remarks
The yellow metal resumed its uptrend on Thursday, even though the US jobless claims report was better than expected, indicating a strong labor market. The number of Americans filing for unemployment benefits dipped from 207K to 203K in the past week, below forecasts of 208K, according to the US Department of Labor.
At the same time, the US trade deficit widened from $102.1 billion to $118.8 billion in July, according to the US Census Bureau.
Worth noting that Gold barely flinched following hawkish statements by Federal Reserve officials attending the Jackson Hole Symposium.
Cleveland Fed's Beth Hammack stated that “now is the time to act given the persistence of inflation.” Earlier, Kansas City Fed's Jeffrey Schmid described inflation as "still stubborn" and "still sticky,” while Chicago Fed's Austan Goolsbee also said inflation is his top concern.
Aside from this, the focus shifts towards Fed Chair Kevin Warsh. Traders should remember that he is against forward guidance, though any remarks about the economy could hint at the future path of interest rates.
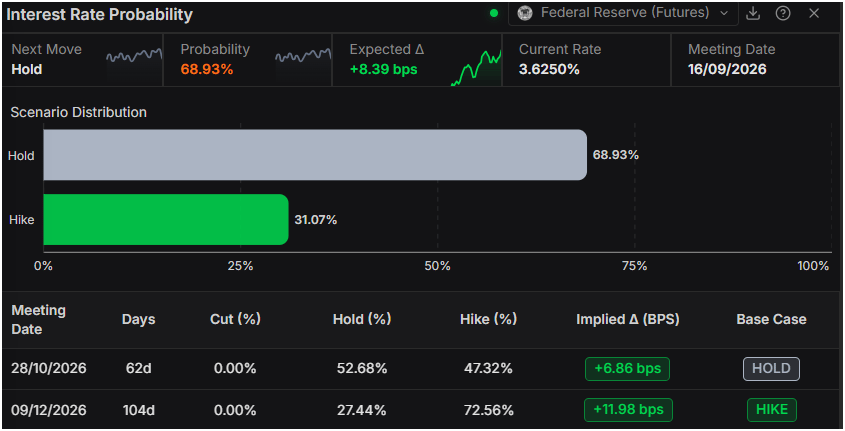
As of writing, money markets expect the Fed to hold rates unchanged at the September 16 meeting, with odds standing at 68%. However, for the December meeting, traders eye a rate hike, with the chances at 72%, according to Prime Terminal.
The US Dollar Index (DXY), which tracks the dollar's performance against six currencies, remains steady at 99.14 after strong data were released over the past two days.
The Greenback recovered some ground, as recent US Core PCE data show that inflation remains stickier than expected and far from reaching the Federal Reserve’s 2% target.
On Friday, the US economic docket, besides featuring Warsh, also includes the University of Michigan Consumer Sentiment data and Nonfarm Payrolls benchmark revision.
XAU/USD technical analysis: Gold reclaims $4,600, but it's poised for consolidation
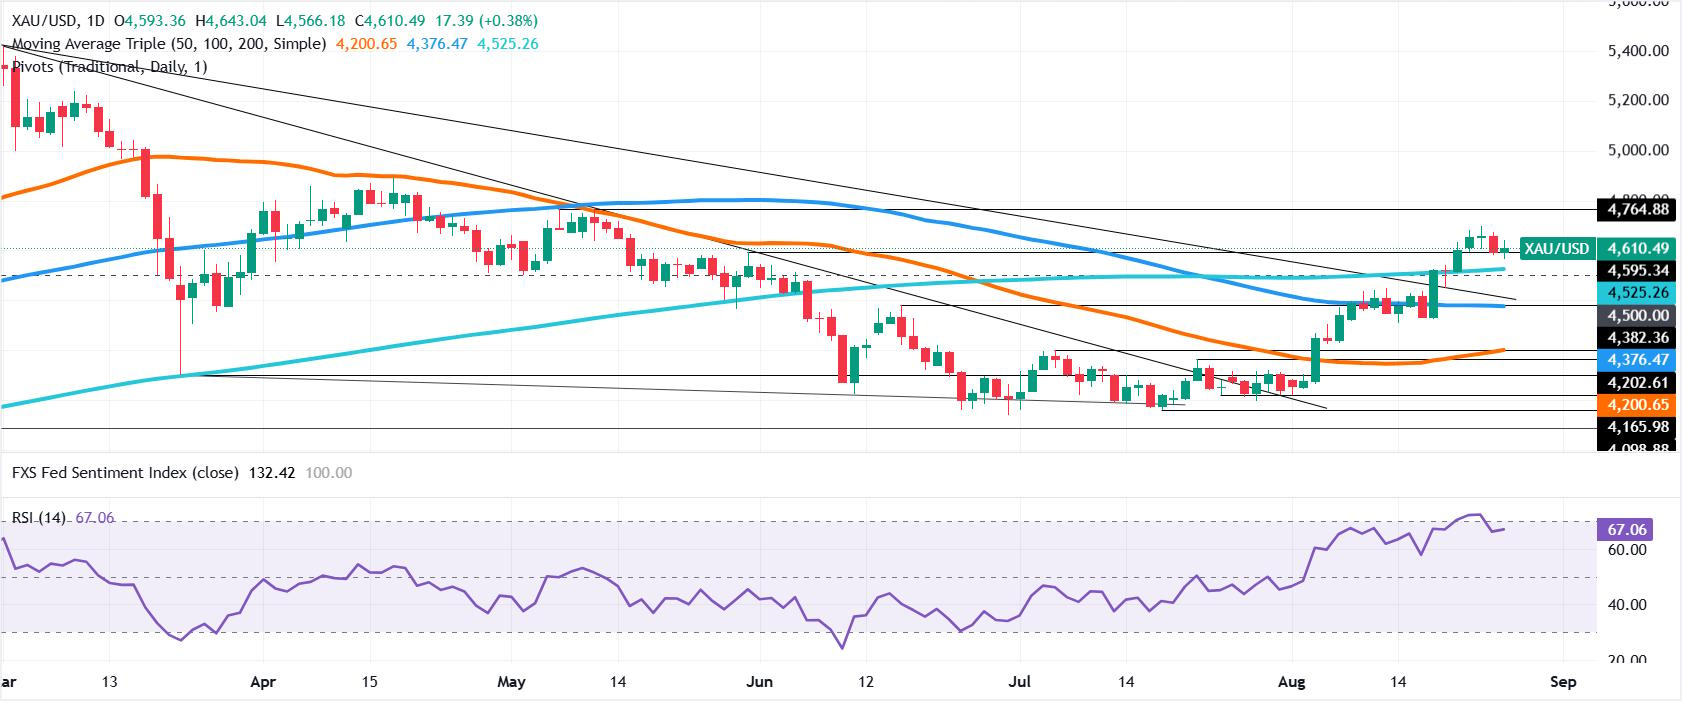
Gold has climbed above $4,600, but it remains shy of a decisive break. Momentum, although bullish, is failing to propel the yellow metal towards a retest of weekly highs near $4,697, as indicated by the Relative Strength Index (RSI). Given the backdrop, further sideways action lies ahead, while traders remain uncertain about Bullion’s direction.
On the upside, the first key resistance is the psychological $4,650 mark. Above, the next ceiling level is $4,700, before buyers drive XAU/USD to May’s 7 peak at $4,764.
Downwards, bullion's first support is $4,600. A breach of the latter would expose the August 24 daily low of $4,594. If XAU/USD achieves a daily close beneath the latter, this clears the path for a move to the 200-day Simple Moving Average (SMA) at $4,376. Ahead of challenging the August 19 swing low of $4,324 and $4,300.
Gold FAQs
Gold has played a key role in human’s history as it has been widely used as a store of value and medium of exchange. Currently, apart from its shine and usage for jewelry, the precious metal is widely seen as a safe-haven asset, meaning that it is considered a good investment during turbulent times. Gold is also widely seen as a hedge against inflation and against depreciating currencies as it doesn’t rely on any specific issuer or government.
Central banks are the biggest Gold holders. In their aim to support their currencies in turbulent times, central banks tend to diversify their reserves and buy Gold to improve the perceived strength of the economy and the currency. High Gold reserves can be a source of trust for a country’s solvency. Central banks added 1,136 tonnes of Gold worth around $70 billion to their reserves in 2022, according to data from the World Gold Council. This is the highest yearly purchase since records began. Central banks from emerging economies such as China, India and Turkey are quickly increasing their Gold reserves.
Gold has an inverse correlation with the US Dollar and US Treasuries, which are both major reserve and safe-haven assets. When the Dollar depreciates, Gold tends to rise, enabling investors and central banks to diversify their assets in turbulent times. Gold is also inversely correlated with risk assets. A rally in the stock market tends to weaken Gold price, while sell-offs in riskier markets tend to favor the precious metal.
The price can move due to a wide range of factors. Geopolitical instability or fears of a deep recession can quickly make Gold price escalate due to its safe-haven status. As a yield-less asset, Gold tends to rise with lower interest rates, while higher cost of money usually weighs down on the yellow metal. Still, most moves depend on how the US Dollar (USD) behaves as the asset is priced in dollars (XAU/USD). A strong Dollar tends to keep the price of Gold controlled, whereas a weaker Dollar is likely to push Gold prices up.
Recommended Articles


