


SK Hynix Stock Forecast: $4 Billion US HBM Packaging Plant for Tariff Access, Will Shares Recover?
TradingKey - On August 27, Eastern Time, SK Hynix ADR (SKHY) held a groundbreaking ceremony for its advanced packaging plant in West Lafayette, Indiana, officially launching this project with an investment of over $4 billion.
The plant will become SK Hynix's first high-bandwidth memory (HBM) advanced packaging facility in the United States, as well as a key project supporting U.S. efforts to localize critical semiconductor supply chains.
Earlier the same day, media reports indicated that the Trump administration is considering introducing a new round of broad semiconductor tariffs, as well as exploring chip import tariff exemptions in exchange for commitments by companies to build or expand factories in the U.S. Under this "investment for market access" policy orientation, overseas chipmakers may further accelerate their localization efforts in the U.S.
Notably, this project is not responsible for front-end wafer fabrication. SK Hynix will produce wafers in South Korea and ship them to Indiana to complete advanced packaging and testing before supplying them to U.S. customers. Advanced packaging can vertically stack or integrate multiple chips within the same package, thereby improving data transfer speeds and energy efficiency. As physical scaling in traditional semiconductor nodes grows increasingly difficult, this technology has become a crucial link in the AI chip supply chain and a relatively weak segment of the U.S. semiconductor supply chain.
HBM is an indispensable core component of advanced AI acceleration systems from companies such as Nvidia (NVDA). The continuous expansion of AI models has driven rapid growth in data center demand for high-bandwidth, low-power memory, propelling SK Hynix to become the second-largest company by market capitalization in South Korea, behind only Samsung Electronics.
For SK Hynix, constructing a packaging facility in the U.S. helps it move closer to key customers such as Nvidia, Microsoft, and Google, while also strengthening the regional layout of its AI memory supply chain.
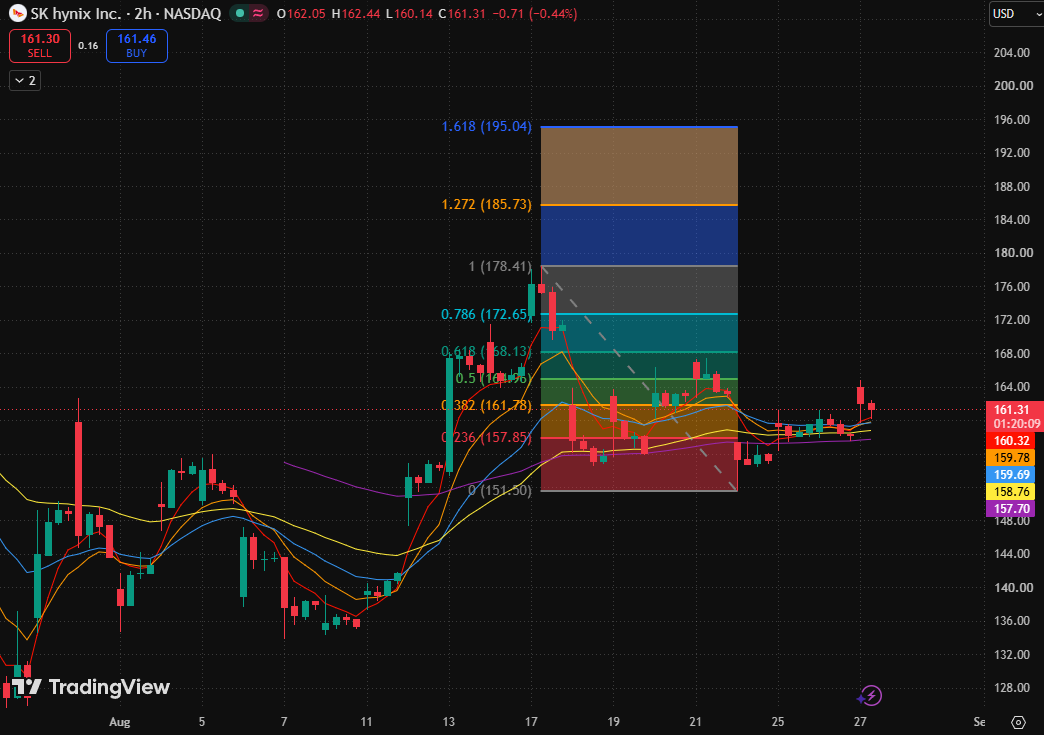
SK Hynix ADR 2-hour stock chart, Source: TradingView
SKHY's current price is slightly below the 0.382 Fibonacci retracement level ($161.78), but remains above the 0.236 Fibonacci retracement level ($157.85) and has moved above the 5-day moving average ($160.32), 10-day moving average ($159.78), 20-day moving average, 80-day moving average, and 160-day moving average.
Therefore, a short-term moving average repair has formed, but the price has not yet firmly consolidated above $161.78, nor has it broken through the 0.5 Fibonacci retracement level ($164.96). A more accurate current characterization is: low-level sideways consolidation and repair following the previous rapid drop, currently in a directional choice phase within the $157.85–$164.96 range, rather than a confirmed uptrend returning to the peak of $178.41.
On the bullish side, if the stock price can effectively reclaim and consolidate above $161.78, and further break through the 0.5 Fibonacci retracement level ($164.96), this round of recovery could shift from a moving-average rebound to a structural strengthening. On the upside, focus sequentially on the 0.618 Fibonacci retracement level ($168.13) and the 0.786 Fibonacci retracement level ($172.65).
On the downside, if the price consistently fails to reclaim $161.78 and falls below the support zone formed by the 20-day moving average ($159.63) and the 80-day moving average ($158.76), it would indicate that the current moving average shift to bullish is closer to a range-bound bounce, and the price may retest the 0.236 Fibonacci retracement level ($157.85).
Recommended Articles


