


Billionaires Are Quietly Loading Up on Amazon While It Trades Like a Value Stock
Key Points
Stanley Druckenmiller, Peter Thiel, Seth Klarman, and David Tepper all bought Amazon stock recently.
Amazon appears to be a high-flying growth stock, but more subtle metrics suggest it could be a value play.
Amazon's diverse ecosystem makes it an attractive opportunity to buy and hold in any economic environment.
- 10 stocks we like better than Amazon ›
Recent 13F filings reveal that a flurry of top hedge fund managers bought the same "Magnificent Seven" stock during the second quarter: Amazon (NASDAQ: AMZN). These purchases by Stanley Druckenmiller, Peter Thiel, Seth Klarman, and David Tepper are more than coincidental portfolio adjustments.
I think this collective bet on Amazon underscores a recognition that the company is evolving far beyond its e-commerce roots into a platform business positioned for durable growth. What unites their thinking is a keen focus on emerging businesses that compound through technological leverage, cash generation, and competitive advantages that others in the big tech ecosystem struggle to replicate at scale.
Missed Nvidia in 2009? This Rare Signal Is Flashing Again. In 2009, a "Double Down" signal flashed for a little-known chipmaker called Nvidia. For the first time in years, that same "Total Conviction" signal is flashing for a company 1/100th the size of Nvidia. Continue »

Image source: The Motley Fool.
Converging on diversification
These hedge fund managers all share a preference for companies that blend defensive cash flow with offensive growth engines. Druckenmiller has long favored asymmetric upside in technology leaders while Thiel prioritizes network effects and monopoly-like businesses. Klarman tends to seek a margin of safety in undervalued assets while Tepper is always on the hunt for cyclical recoveries with secular tailwinds. Amazon satisfies each of these criteria.
Amazon's strength in artificial intelligence (AI) stems from its cloud computing division, Amazon Web Services (AWS). AWS provides a computational backbone for training and deploying AI models at a global scale. Beyond this, Amazon's logistics network, advertising platform, and subscription services (Prime) create a reinforcing ecosystem: Data from retail and enterprise customers improves ad targeting, fulfillment efficiency lowers delivery costs, and cloud infrastructure monetizes the resulting intelligence.
The company's diversification is the subtle strength here. Retail shoppers generate order volume, which helps Amazon build relationships with its customers. Advertising extracts high-margin revenue from these relationships while AWS delivers operating leverage. As a result, the company is able to reinvest in emerging efforts across robotics and custom silicon -- helping reduce dependency on external suppliers and manufacturers. Amazon's multi-legged stool reduces the risk of a single point of failure while amplifying returns.
The simultaneous buying by all these billionaire investors suggests they saw the last few months as a window where the market remained distracted by near-term retail pressures from inflation, ultimately obscuring the accelerating contribution from higher-margin, technology-enabled segments.
How should you value Amazon?
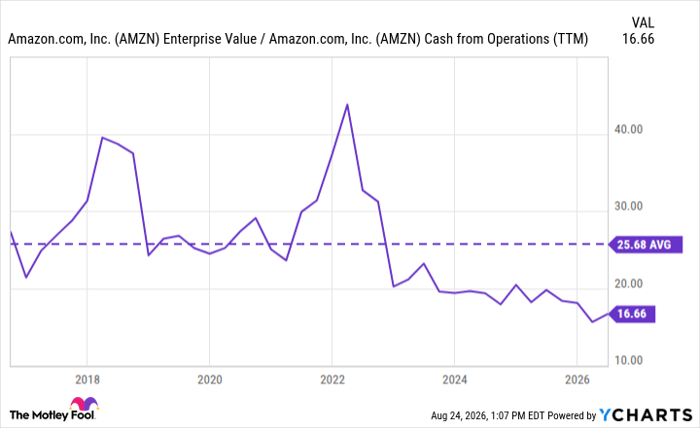
Amazon is a tricky stock to assess. While the company's price-to-earnings (P/E) ratio of 21 has compressed over the last year, this multiple could still appear elevated relative to more traditional industrial or retail peers. I think viewing Amazon through the lens of enterprise value (EV) relative to operating cash flow (OCF) paints a much different picture -- one in which the stock actually trades near historically low levels.
Operating cash flow better captures the real economic output of a business before the distorting effects of depreciation, stock-based compensation, and capital expenditures (capex). As the chart below illustrates, Amazon's ratio of enterprise value to operating cash flow currently hovers around 17, well below its 10-year average of 26.
Fundamental Chart data by YCharts
Since Amazon continually reinvests to expand capacity, its earnings can lag underlying cash generation. For this reason, the EV-to-OCF ratio better isolates the company's cash-generation potential once growth spending starts moderating or begins to yield higher incremental returns.
Against this backdrop, Amazon starts to resemble a hidden value stock: The market appears to be pricing it as a high-multiple hyperscaler while the cash metrics shown above reveal a business generating substantial liquidity at a discount relative to its long-term trajectory.
Savvy fund managers tend to prioritize cash flow and reinvestment runways over the optics of short-term earnings. I think the purchases discussed above imply that some money managers identified a temporary disconnect between Amazon's reported valuation multiples and the durability of the company's cash conversion.
What catalysts does Amazon have?
Amazon's horizon has several catalysts. Most obvious is AWS, which continues to expand its market share of enterprise AI workloads -- converting accelerating utilization into recurring high-margin revenue. Robotics initiatives should fuel productivity gains across Amazon's warehouses and last-mile delivery operations, helping lower unit costs as volume scales.
Moreover, the company's custom chips business aims to reduce reliance on external silicon designers and creates an additional product line beneath the AWS umbrella. Lastly, the anticipated IPO of Anthropic -- in which Amazon holds a significant equity stake -- should better crystallize the value of its generative AI ecosystem and provide a more visible validation of the company's strategic partnerships.
Taken together, these emerging opportunities support a compelling buy-and-hold thesis for Amazon stock. The company's unparalleled scale advantages, proven reinvestment discipline, and expanding technological moat suggest that disciplined capital will benefit from compounding effects over a long-term time horizon.
The recent moves by several fund managers highlight that the broader market may still be underappreciating the breadth and scale of Amazon's optionality. For investors willing to look past near-term volatility and focus on future cash generation, ongoing diversification, and AI-enabled operating leverage, the stock presents a unique intersection of growth and relative value.
Should you buy stock in Amazon right now?
Before you buy stock in Amazon, consider this:
The Motley Fool Stock Advisor analyst team just identified what they believe are the 10 best stocks for investors to buy now… and Amazon wasn’t one of them. The 10 stocks that made the cut could produce monster returns in the coming years.
Consider when Netflix made this list on December 17, 2004... if you invested $1,000 at the time of our recommendation, you’d have $443,461!* Or when Nvidia made this list on April 15, 2005... if you invested $1,000 at the time of our recommendation, you’d have $1,307,633!*
Now, it’s worth noting Stock Advisor’s total average return is 973% — a market-crushing outperformance compared to 213% for the S&P 500. Don't miss the latest top 10 list, available with Stock Advisor, and join an investing community built by individual investors for individual investors.
See the 10 stocks »
*Stock Advisor returns as of August 26, 2026.
Adam Spatacco has positions in Amazon. The Motley Fool has positions in and recommends Amazon. The Motley Fool has a disclosure policy.
Recommended Articles


