


British Pound retreats as sticky PCE revives Fed hike bets
- GBP/USD drops below 1.3600 as Dollar rebounds after PCE.
- Core PCE holds steady, keeping December Fed hike bets elevated.
- Warsh’s Jackson Hole speech could clarify Fed’s policy path.
Sterling retreats some 0.39% as the US Dollar stages a recovery after a US inflation report revealed that prices remained elevated, increasing the chances of seeing a rate hike by the Federal Reserve (Fed) towards the end of the year. The GBP/USD exchanged hands below 1.3600, after reaching a high near 1.3651.
GBP/USD slips as firm PCE, stronger data lift Dollar before Jackson Hole
US economic data revealed that the Core Personal Consumption Expenditures (PCE) Price Index in July was in line with estimates and unchanged from June’s 3.3% YoY. Headline PCE steadied at 3.7% YoY, above estimates of 3.6%.
Other data showed that the US economy grew at a 1.5% annual pace in Q2 2026 as expected, while Durable Goods Orders doubled June’s print of 0.5%, coming in at 1.1% MoM and exceeding forecasts.
After the data, the US Dollar Index (DXY), which tracks the performance of the buck’s value against a basket of six currencies, is up 0.27%, at 99.17. US Treasury yields also rose, with the 10-year benchmark note edging up four basis points at 4.664%, while investors increased their hawkish bets on the Fed.
Money markets had priced in a narrow 39% chance of a rate hike in the September meeting, according to Prime Terminal. But for December, they had priced in 27 basis points (bps) of tightening, with the odds at 74% for a 25-bps increase.
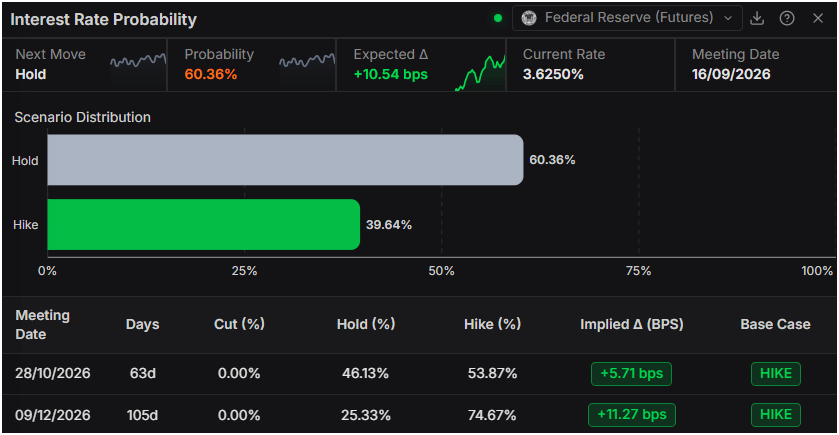
Now eyes will be on Fed Chair Kevin Warsh's speech on Friday at the Jackson Hole Symposium.
In the UK, the economic schedule was absent on Wednesday, yet GBP/USD is leaning on global developments, market sentiment, broader market dynamics, and U.S. developments.
Ahead, the US economic docket will feature Initial Jobless Claims on Thursday, followed by the University of Michigan Consumer Sentiment Index, and Warsh’s speech.
GBP/USD Price Forecast: Technical outlook
In the daily chart, GBP/USD trades around 1.3594, maintaining a constructive bullish tone as price holds above the cluster of reclaimed trend-line breaks and the 50/100/200-day simple moving averages (SMA) grouped near 1.3410. The pair is also supported by the former downward resistance line broken at 1.3396 and the secondary rising trend-line break at 1.3390, while the Relative Strength Index (RSI) around 60 suggests positive but not overstretched momentum.
On the topside, initial resistance emerges at the rising support trend-line break now acting as a cap near 1.3628, ahead of the horizontal barrier at 1.3676, which marks a more significant hurdle for bulls. On the downside, immediate support is seen at the reclaimed descending trend-line break around 1.3490, with the dense moving-average and trend-line cluster between 1.3410 and 1.3390 expected to underpin the broader bullish bias on any deeper pullback.
(The technical analysis of this story was written with the help of an AI tool. Know more.)
Pound Sterling Price Today
The table below shows the percentage change of British Pound (GBP) against listed major currencies today. British Pound was the strongest against the New Zealand Dollar.
| USD | EUR | GBP | JPY | CAD | AUD | NZD | CHF | |
|---|---|---|---|---|---|---|---|---|
| USD | 0.19% | 0.41% | 0.10% | 0.23% | -0.11% | 0.60% | 0.51% | |
| EUR | -0.19% | 0.22% | -0.09% | 0.05% | -0.27% | 0.41% | 0.32% | |
| GBP | -0.41% | -0.22% | -0.30% | -0.17% | -0.50% | 0.20% | 0.10% | |
| JPY | -0.10% | 0.09% | 0.30% | 0.13% | -0.20% | 0.51% | 0.41% | |
| CAD | -0.23% | -0.05% | 0.17% | -0.13% | -0.33% | 0.39% | 0.28% | |
| AUD | 0.11% | 0.27% | 0.50% | 0.20% | 0.33% | 0.72% | 0.61% | |
| NZD | -0.60% | -0.41% | -0.20% | -0.51% | -0.39% | -0.72% | -0.10% | |
| CHF | -0.51% | -0.32% | -0.10% | -0.41% | -0.28% | -0.61% | 0.10% |
The heat map shows percentage changes of major currencies against each other. The base currency is picked from the left column, while the quote currency is picked from the top row. For example, if you pick the British Pound from the left column and move along the horizontal line to the US Dollar, the percentage change displayed in the box will represent GBP (base)/USD (quote).
Recommended Articles


