


Alibaba Stock Forecast: Share Placement Doesn't Change Positive Investment Logic as Financing Removes Funding Uncertainty
TradingKey - After Alibaba (BABA) announced its share placement, the market initially responded with a sell-off, but the stock price did not continue to lose ground. Meanwhile, several top investment banks still maintain a positive outlook on the company.
On August 24, Alibaba's Hong Kong-listed shares closed at HK$112.5, just HK$0.2 below the placement price of HK$112.7; although the stock dipped to HK$110.1 intraday, it recovered most of its losses in late trading. Previously, the company announced its first share placement since its 2019 Hong Kong listing, intending to place 710 million new shares at HK$112.7 per share, representing a discount of approximately 8.37% to the closing price of HK$123 on August 21.
The fact that the stock price did not fall significantly further below the placement price indicates that after digesting equity dilution and heavy AI capital expenditures, the market's panic selling regarding this financing has eased. In addition, the completion of the financing has eliminated market uncertainty over its subsequent funding requirements.
Alibaba Shares Fall as Financing Method Exceeds Expectations
Nomura believes the actual impact of this financing on existing shareholders is far smaller than market concerns and helps eliminate the long-standing financing uncertainty hanging over the stock price.
The firm stated that the market's brief volatility over the share placement mainly stemmed from the financing method being unexpected, rather than the fundraising itself. The bank estimates that the approximately 710 million new shares will dilute existing shareholders by about 3.7%, which remains within a manageable range and does not alter its positive investment thesis. Upon completion of the placement, Alibaba's total cash and cash equivalents are projected to rise from roughly $70 billion as of the end of the June quarter to around $80 billion.
Nomura pointed out that the market had already widely anticipated Alibaba's need for external funding. Amid the global AI capex boom, widening credit spreads in the bond market, larger new-issue concessions, and lower investor subscription multiples have diminished the relative appeal of debt financing, making the company's shift toward equity financing understandable.
BofA Securities takes a more positive view, regarding the placement as a financing initiative by Alibaba to drive growth, broaden funding sources, and proactively strengthen its balance sheet. The bank noted that the HK$80 billion in proceeds will be fully invested in full-stack AI capabilities and infrastructure buildout, pushing the group's net cash position from about $31 billion to over $41 billion after the fundraising.
BofA remains bullish on management's strong guidance for cloud business growth, improving economic efficiency from AI investments, and a sequential recovery in free cash flow, maintaining its $172 price target on Alibaba's US-listed shares and a "Buy" rating.
Alibaba Technical Analysis
After Alibaba's stock price peaked near $132, its high points gradually shifted downward, with a rapid recent pullback. The price also fell from above the moving averages to below them, indicating that short-term selling pressure has regained the upper hand.
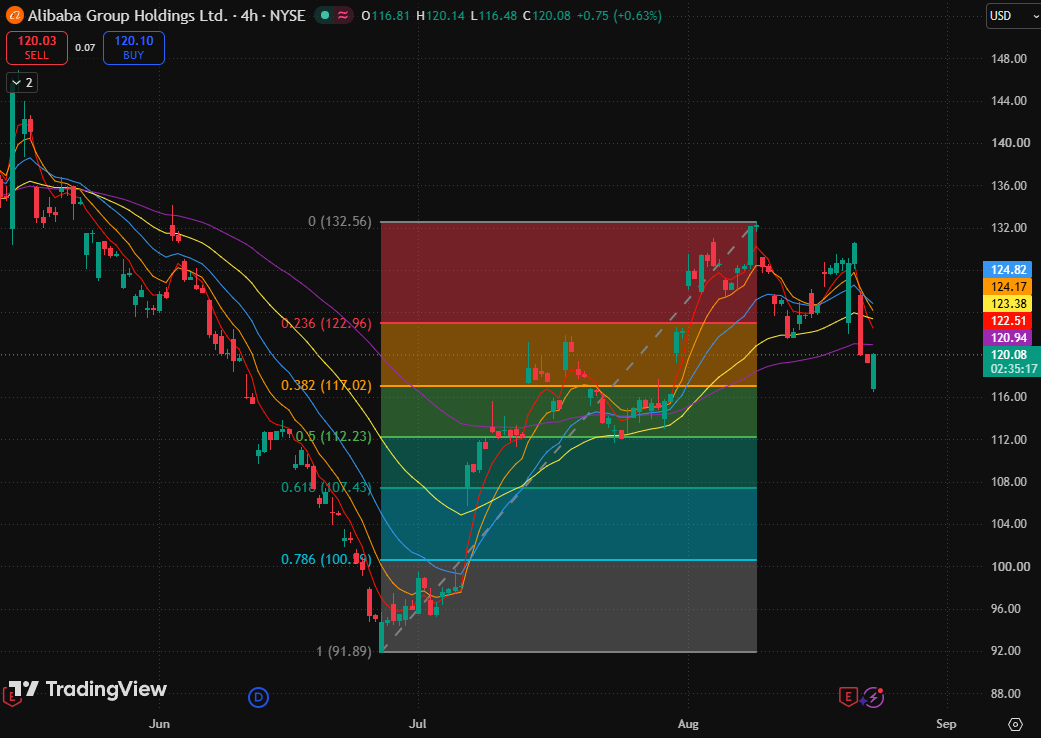
Alibaba 4-hour stock price chart, Source: TradingView
Currently, the primary support lies at the 0.382 Fibonacci retracement level ($117.02). If a rebound fails to reclaim this level, it indicates that the correction is continuing, potentially opening up further downside room, with the price possibly pulling back toward the 0.5 Fibonacci retracement level ($112.23).
On the upside, the 80-day moving average ($123), the 5-day moving average ($122), and the 0.236 Fibonacci retracement level ($122.96) are currently the most important resistance levels.
If the stock price convincingly breaks above this price range, it is expected to reverse the current short-term weakness and further challenge the interim peak ($132.56).
Recommended Articles


