


British Pound holds firm as the US sanctions on Iran loom
- Sterling Bessent warns Tehran of economic D-Day, supporting Dollar.
- Iran threatens oil exports if economic war continues.
- Warsh speech and Core PCE drive next Fed catalyst.
The Pound Sterling holds firm against the US Dollar at around 1.3640, with traders eyeing speeches by US Treasury Secretary Scott Bessent on Iran’s sanctions and by Fed Chair Kevin Warsh at the Kansas City Fed Jackson Hole Symposium. The GBP/USD trades near its opening price, barely unchanged.
GBP/USD steadies as Dollar gains on renewed geopolitical risk
Developments over the weekend keep the Grenback bid. US Treasury Secretary Bessent wrote an article in the Financial Times, warning Tehran that an economic D-Day is coming and stating that countries linked to the regime could face retaliation by Washington.
Bessent is expected to delve deeper into Iran at a press conference, followed by a Q&A session, at around 1700 GMT.
Iran’s answer to Bessent column was that “If the economic war continues, not a single drop of oil will be exported٫ neither through the Strait of Hormuz nor from anywhere in the Persian Gulf.”
In the meantime, the US Dollar Index (DXY), which tracks the buck’s value against a basket of six currencies, is up 0.15% at 98.98, capping Sterling’s advance.
On Monday, the US economic docket is absent, but it will gather pace on Tuesday, with housing data and the Conference Board's Consumer Confidence. On Wednesday, Gross Domestic Product (GDP) figures are eyed, along with Durable Goods Orders, followed the next day by the Fed’s inflation gauge, the Core PCE
On Friday, traders will digest Warsh’s speech, which is not expected to provide forward guidance, regarding interest rates. However, if he updates his economic status, he could perhaps provide some clues about the economic outlook.
In the UK, Prime Minister Andy Burnham told European Council President, Antonio Costa, that Great Britain will be bolder in closing ties with the European Union
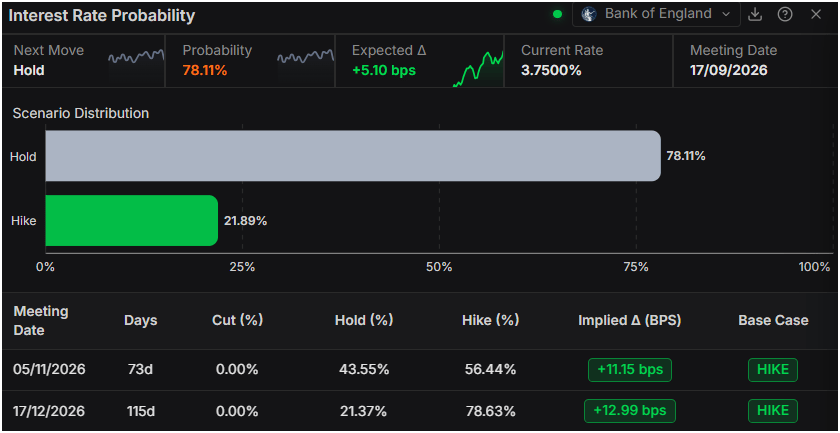
In the meantime, the GBP/USD appreciated in the short term, even though investors see no chance for a rate hike by the Bank of England at the September meeting. The odds are 78% of holding rates, but for the December meeting, the chances are also 78% of a 25-basis-point increase, revealed Prime Terminal.
GBP/USD Price Forecast: Technical outlook
In the daily chart, GBP/USD trades at 1.3634, extending its advance above the cluster of reclaimed trend lines and the simple moving average triple around 1.3400, which now underpin a bullish near-term bias. The pair holds comfortably over the upward support lines drawn from 1.3159 and 1.3140, while the Relative Strength Index (14) at 69.3 flirts with overbought territory, suggesting strong but potentially stretched upside momentum rather than immediate exhaustion.
On the downside, initial support aligns near 1.3622 at the more recent rising trend line, ahead of a broader demand band between the reclaimed downward line at 1.3493 and the former resistance trend break at 1.3400, reinforced by the simple moving average cluster at 1.3399 and the older upward support trend around 1.3382. With no well-defined resistance levels in the immediate data set, the pair would likely remain constructive as long as it holds above this layered support zone, though overbought daily momentum warns that any pullback could first test these trend and moving average floors.
(The technical analysis of this story was written with the help of an AI tool. Know more.)
Pound Sterling Price Today
The table below shows the percentage change of British Pound (GBP) against listed major currencies today. British Pound was the strongest against the Canadian Dollar.
| USD | EUR | GBP | JPY | CAD | AUD | NZD | CHF | |
|---|---|---|---|---|---|---|---|---|
| USD | 0.10% | 0.08% | 0.08% | 0.53% | 0.27% | 0.30% | 0.12% | |
| EUR | -0.10% | 0.00% | 0.00% | 0.45% | 0.19% | 0.26% | 0.04% | |
| GBP | -0.08% | -0.00% | 0.02% | 0.46% | 0.18% | 0.27% | 0.04% | |
| JPY | -0.08% | 0.00% | -0.02% | 0.51% | 0.12% | 0.22% | 0.03% | |
| CAD | -0.53% | -0.45% | -0.46% | -0.51% | -0.34% | -0.17% | -0.41% | |
| AUD | -0.27% | -0.19% | -0.18% | -0.12% | 0.34% | 0.08% | -0.13% | |
| NZD | -0.30% | -0.26% | -0.27% | -0.22% | 0.17% | -0.08% | -0.22% | |
| CHF | -0.12% | -0.04% | -0.04% | -0.03% | 0.41% | 0.13% | 0.22% |
The heat map shows percentage changes of major currencies against each other. The base currency is picked from the left column, while the quote currency is picked from the top row. For example, if you pick the British Pound from the left column and move along the horizontal line to the US Dollar, the percentage change displayed in the box will represent GBP (base)/USD (quote).
Recommended Articles


