

Pi Network Price Forecast: Mild recovery lifts key two-month long resistance breakout hopes

Source Fxstreet
  • Pi Network edges higher on Tuesday, holding between its 50-day EMA at $0.0940 and the $0.0971 key resistance.
  • PI derivatives data points to steady positional buildup with Open Interest holding above $9 million.
  • The technical outlook for PI shows a near-term bullish bias, with upside momentum holding firm.

Pi Network (PI) price is up nearly 2% on Tuesday, advancing its modest 5% gains from the previous day. Retail demand holds firms, with steady positional buildup in PI futures. The technical outlook for PI shows near-term upside bias, with bulls targeting a confirmed breakout above $0.0971.

Retail demand shows early signs of recovery

Pi Network futures data suggest retail demand holding firm. According to CoinAnk, the PI futures Open Interest (OI) stands at $9.60 million, up from $9.20 million the previous day, indicating an increase in the notional value of active contracts or fresh positional buildup.
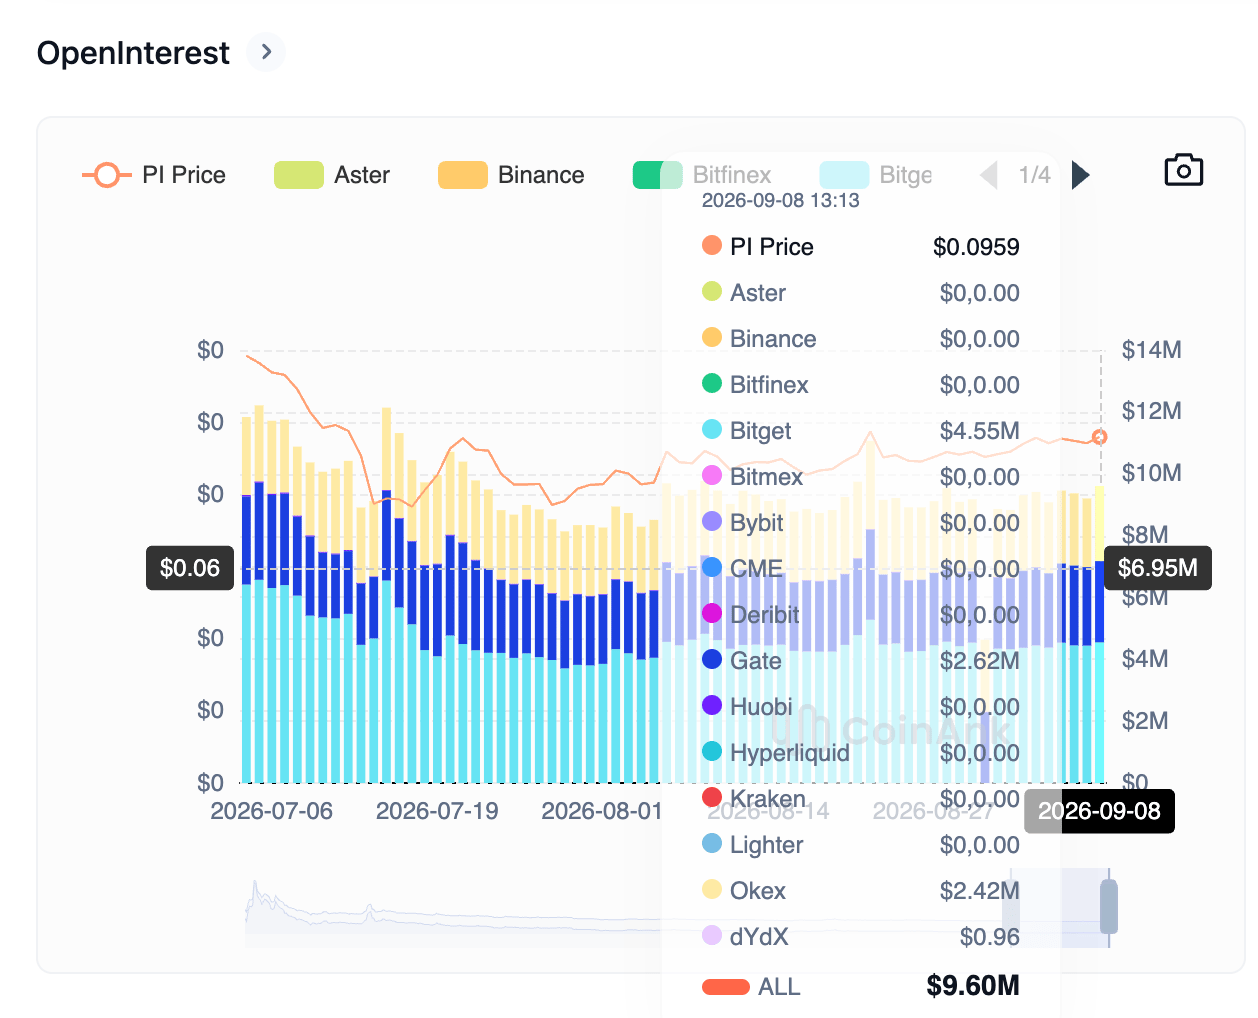
PI token Open Interest chart. Source: CoinAnk

In addition, the recent attempts to boost ecosystem utilities and adoption, such as new Solohost apps, Robopay partnership, the return of OpenPay Cash-in feature and the new developers functionalities support the near-tern optimistic outlook.

Technical outlook: Could PI extend gains above $0.10?

Pi Network trades above $0.0950 at press time on Tuesday, holding a capped near-term tone below the 78.6% Fibonacci retracement of the $0.1341 to $0.0703 downswing at $0.0971 resistance level. The resistance remains intact since mid-July, emerging as a crucial sell wall.

PI holds above the 50-day Exponential Moving Average (EMA) at $0.0940, suggesting some short-term underpinning, but the overhead 100-day and 200-day EMAs roughly $0.1064 and $0.1439, reaffirming the capped tone. The Relative Strength Index (RSI) near 58 on the daily chart hints at improving momentum with an upward slope above the midline.

A confirmed breakout above $0.0971 could target the 100-day EMA at $0.1063, followed by the 78.6% Fibonaci retracement level at $0.1168.
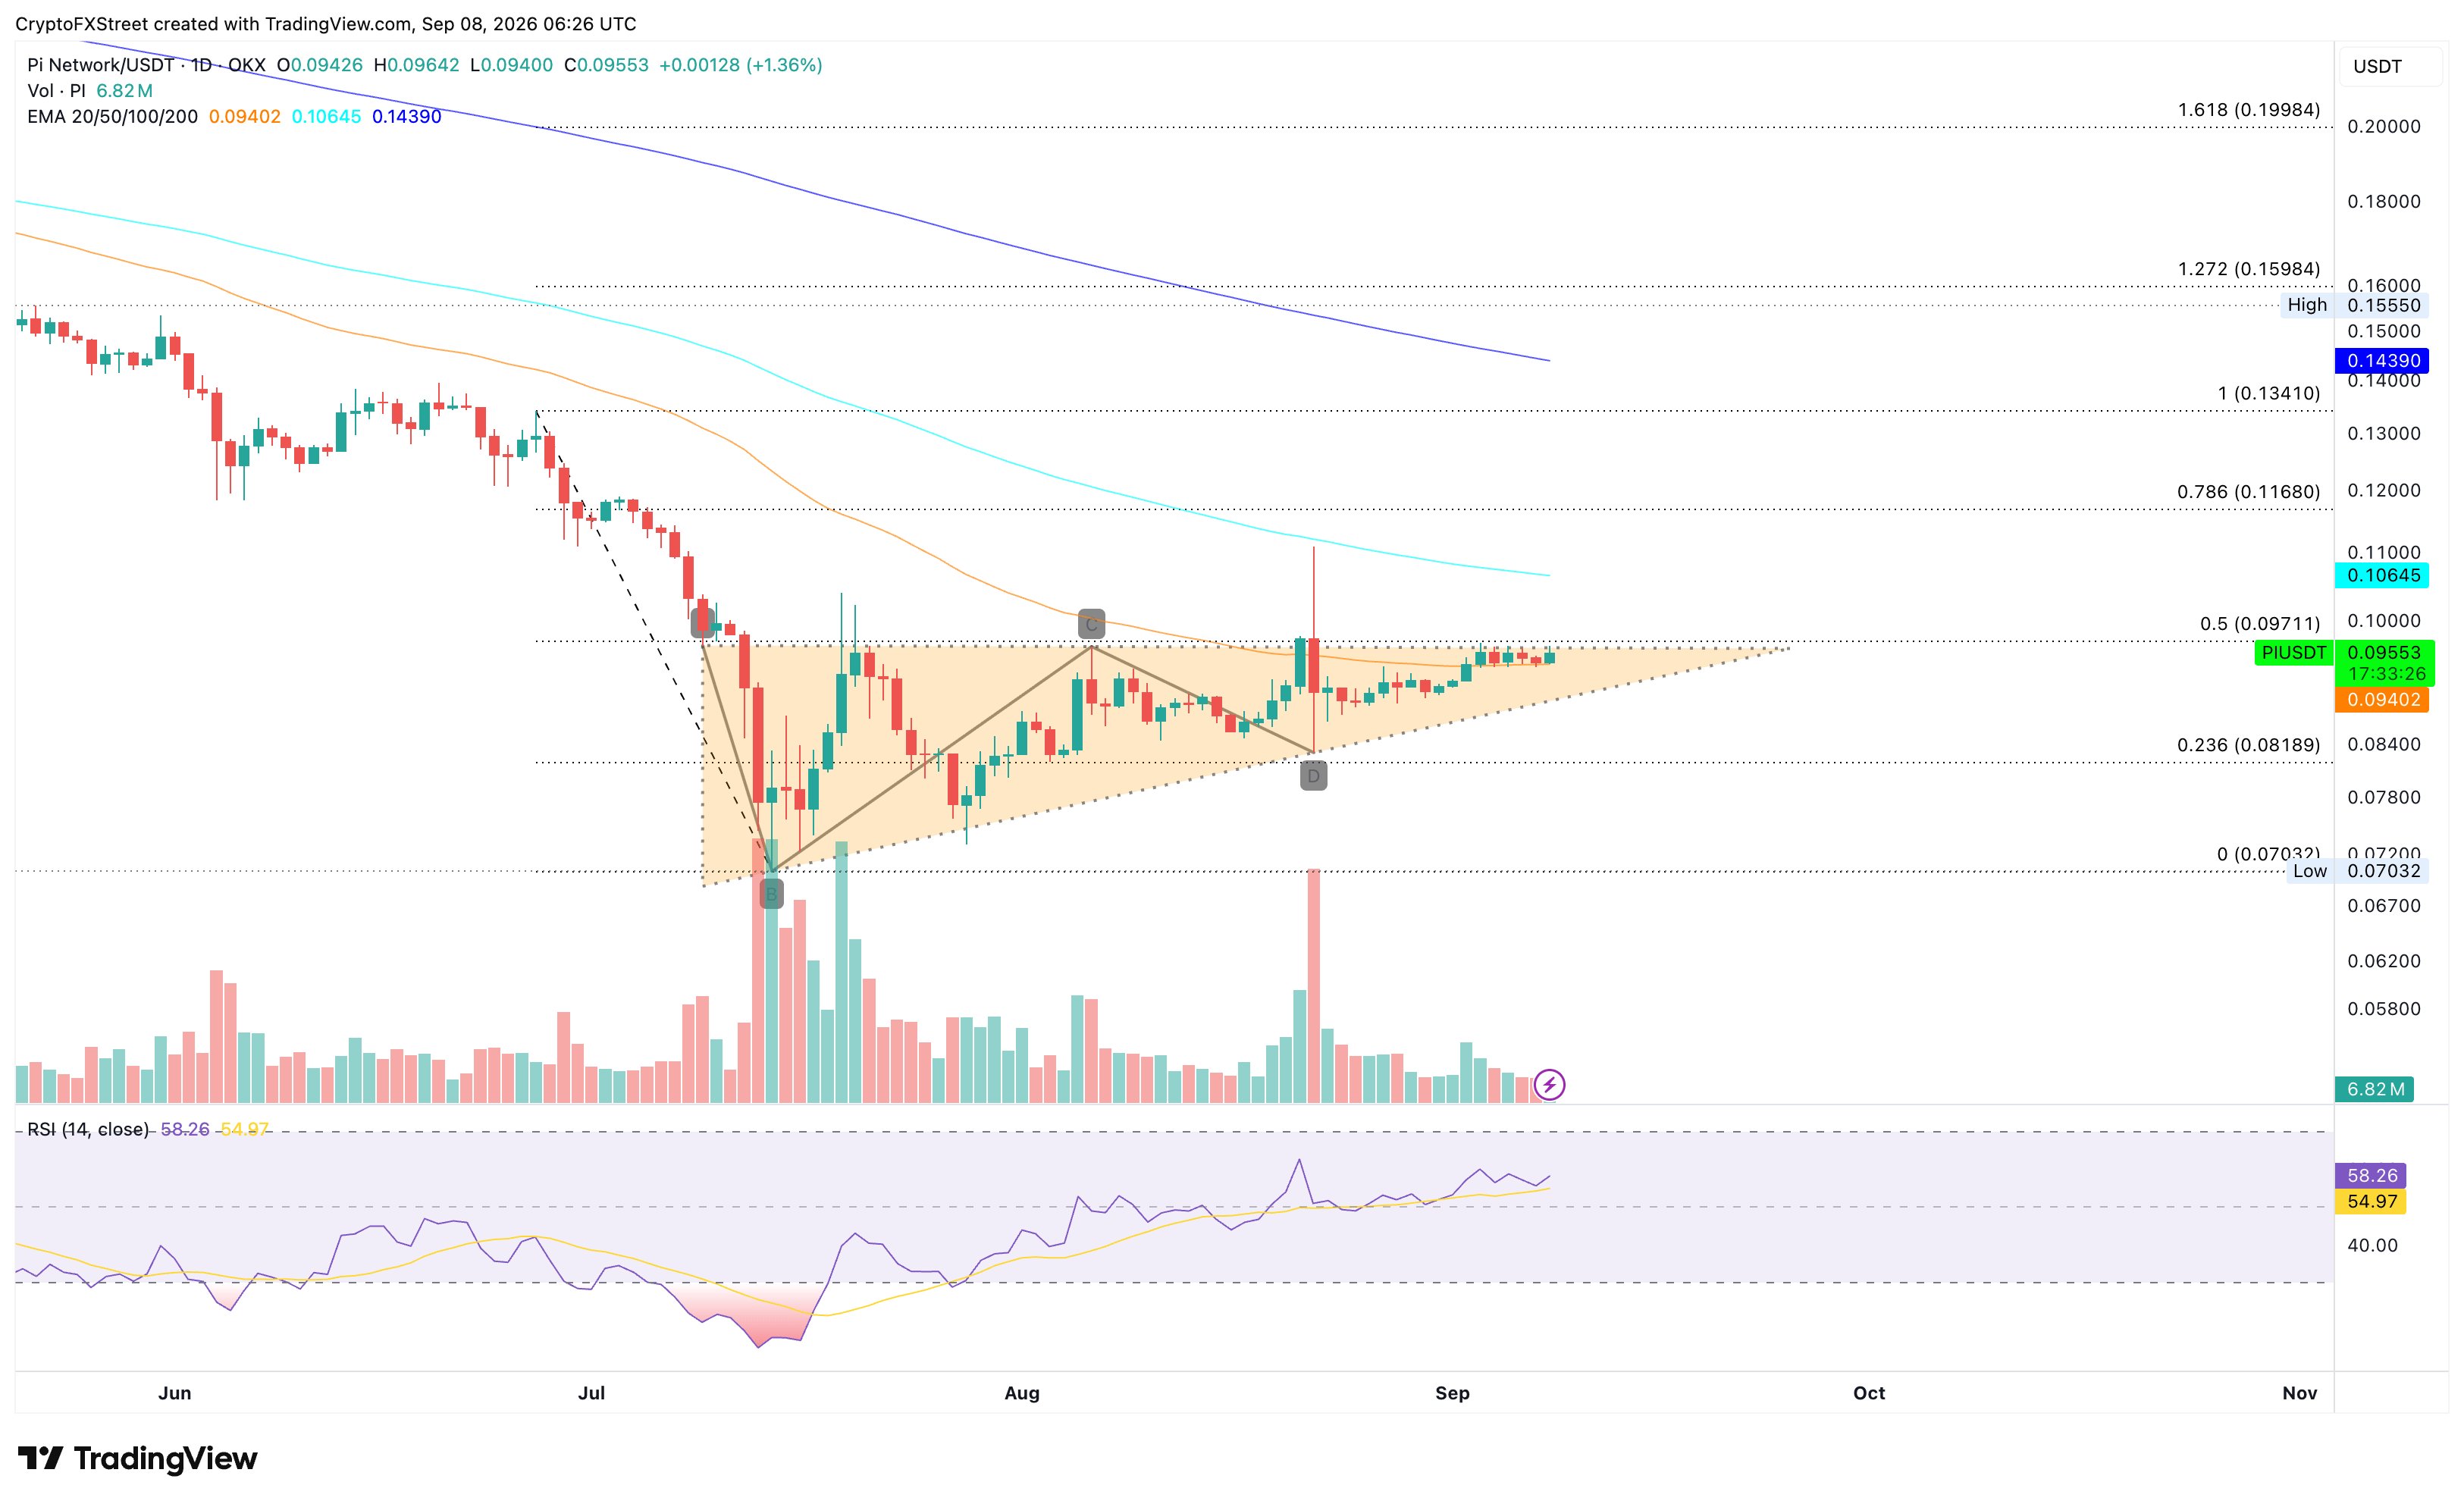
PI/USDT daily price chart.

On the downside, the 50-day EMA at approximately $0.0940 offers immediate support. A daily close below this level would expose PI to renewed downside pressure, targeting the 23.6% Fibonacci retracement level at $0.0818.

(The technical analysis of this story was written with the help of an AI tool. Know more.)

Disclaimer: For information purposes only. Past performance is not indicative of future results.
placeholder
Will the Tech Rally Continue? The Technical Verdict on the NASDAQ 100 Riding a massive 32% post-earnings wave, the Nasdaq-100 is showing its first signs of exhaustion. We break down crucial exit and entry rules for long positions this week.
Author  Mitrade Team
Jun 05, Fri
Riding a massive 32% post-earnings wave, the Nasdaq-100 is showing its first signs of exhaustion. We break down crucial exit and entry rules for long positions this week.
placeholder
XRP Price Prediction for July 2026: Can Buyers Finally Break the Downtrend?XRP (XRP) price trades near $1.05, caught between a year-long downtrend and a sudden burst of buying.July has historically rewarded XRP holders. This year the month arrives with on-chain accumulation
Author  Beincrypto
Jun 30, Tue
XRP (XRP) price trades near $1.05, caught between a year-long downtrend and a sudden burst of buying.July has historically rewarded XRP holders. This year the month arrives with on-chain accumulation
placeholder
XAUUSD Gold Analysis: Gold Holds Above $4,350 Ahead of US Inflation Data Is $4,500 Next? Gold holds above $4,350 following weak US jobs data. As inflation reports approach and UBS eyes $5,000, can XAUUSD break resistance at $4,435 to rally toward $4,500?
Author  Naoufal Seddik
Aug 12, Wed
Gold holds above $4,350 following weak US jobs data. As inflation reports approach and UBS eyes $5,000, can XAUUSD break resistance at $4,435 to rally toward $4,500?
placeholder
Gold Price Analysis Today: Gold Drops 1.32% Despite Lower Fed Rate-Hike Bets, Can $4,313 Support Hold? Gold fell 1.32% on August 13 after rising to $4,449.73, then reversing lower and closing near $4,349.918 below the $4,356.46 support. Softer US inflation data reduced Fed rate hike expectations, but selling pressure still dominated the session. Will $4,313 support hold?
Author  Naoufal Seddik
Aug 14, Fri
Gold fell 1.32% on August 13 after rising to $4,449.73, then reversing lower and closing near $4,349.918 below the $4,356.46 support. Softer US inflation data reduced Fed rate hike expectations, but selling pressure still dominated the session. Will $4,313 support hold?
placeholder
Gold Price Analysis Today: Gold Gains 0.94% as Markets Expect Fed to Hold Rates, Can $4,449 Resistance Break? Gold gained 0.94% on August 17, closing near $4,417.30 as softer US data strengthened expectations for unchanged Fed rates in September. Gold remains bullish, with $4,449.730 resistance and $4,310.650 support in focus.
Author  Naoufal Seddik
Aug 18, Tue
Gold gained 0.94% on August 17, closing near $4,417.30 as softer US data strengthened expectations for unchanged Fed rates in September. Gold remains bullish, with $4,449.730 resistance and $4,310.650 support in focus.
goTop
quote