

Bitcoin Stages V-Shaped Reversal, Surging Past $83,000: Is the Bear Trap Defused?

Source Tradingkey

TradingKey - Bitcoin stages a dramatic counteroffensive, surging past $83,000 as bulls return in force.

On October 9 Eastern Time, Bitcoin (BTC) demonstrated strong resilience after dipping to the $80,000 support zone, successfully executing a V-shaped reversal to forcefully breach the $83,000 mark, temporarily trading at $83,271 and largely recovering the previous day's losses.
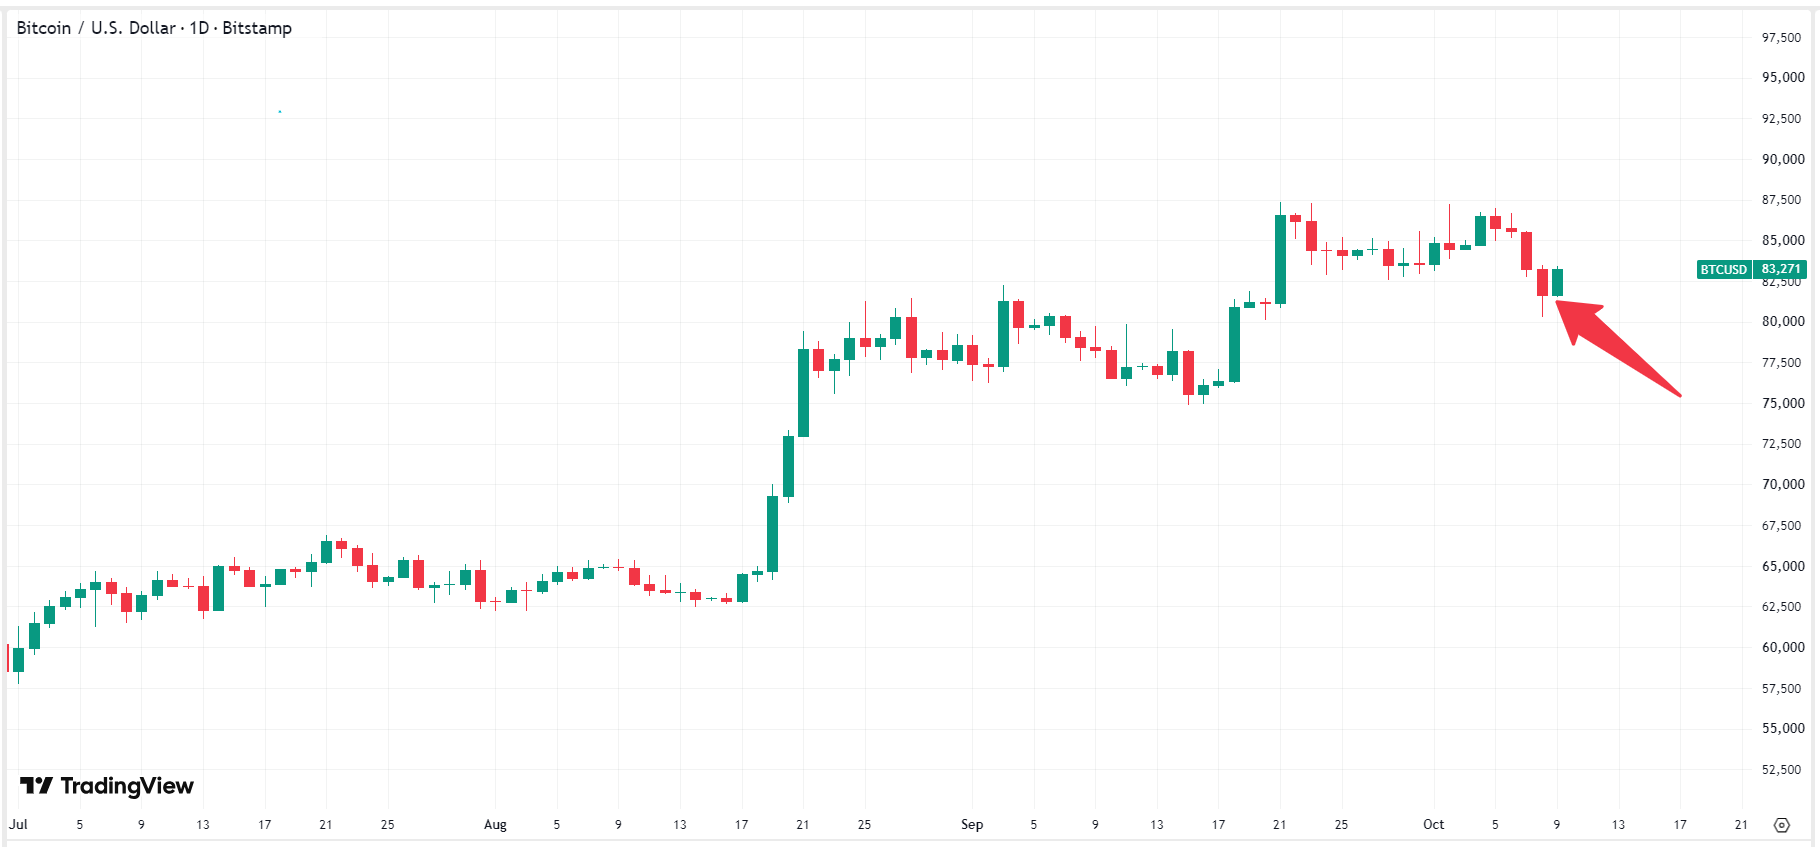
bitcoin-btc-price-89dbb18b70ab4d7b8c02911dc5f38d22Bitcoin Price Chart, Source: TradingView

Bitcoin's V-shaped reversal not only validated the strength of the $80,000–$82,000 range as a bull defense zone, but also swiftly cleared high-leverage short positions built up during the market panic of recent days. Over the past four hours, network-wide liquidations exceeded $58 million, with short liquidations accounting for nearly $46 million, or close to 80%.
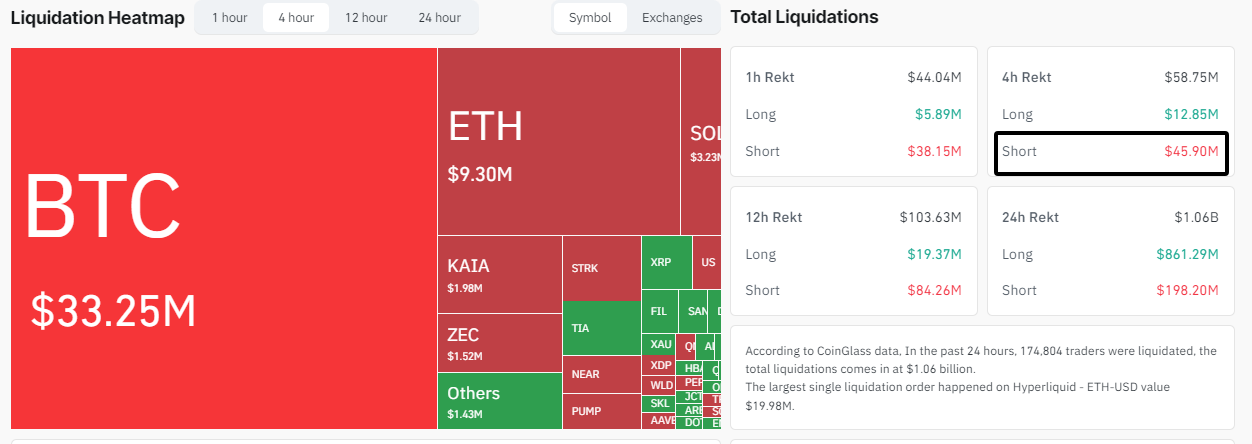
Crypto-liquidation-Long-short-19c8b390a1e14e4fabc8a9042e31da4fCrypto Market Liquidation Data (4-Hour), Source: CoinGlass

The Bitcoin price rebound was not driven by positive news, but rather by internal market capital dynamics. As a psychological round number, $80,000 attracted buy orders from US institutions buying the dip, while derivative funding rates returned from overheated levels to a healthy neutral state, completing an efficient turnover of positions.

Furthermore, during Bitcoin's four-consecutive-day decline, a large amount of short-chasing capital gathered in the $82,000–$83,000 range. When prices received strong buying support near $80,000 and rebounded rapidly, it triggered a chain reaction of short liquidations, pushing prices higher to fill the gap at an accelerated pace.

Bitcoin's V-shaped reversal formed a classic 'false breakdown, real bear trap' pattern. As long as subsequent retests do not materially break below $82,000, short-term bulls will remain firmly in control. However, Bitcoin will face a strong resistance zone at $85,000–$86,000 on its way up, an area densely populated by previous highs. Strong net inflows from spot ETFs will be required to potentially launch the next major upward wave aiming for $90,000+.

Disclaimer: For information purposes only. Past performance is not indicative of future results.
placeholder
XRP Price Prediction for July 2026: Can Buyers Finally Break the Downtrend?XRP (XRP) price trades near $1.05, caught between a year-long downtrend and a sudden burst of buying.July has historically rewarded XRP holders. This year the month arrives with on-chain accumulation
Author  Beincrypto
Jun 30, Tue
XRP (XRP) price trades near $1.05, caught between a year-long downtrend and a sudden burst of buying.July has historically rewarded XRP holders. This year the month arrives with on-chain accumulation
placeholder
XAUUSD Gold Analysis: Gold Holds Above $4,350 Ahead of US Inflation Data Is $4,500 Next? Gold holds above $4,350 following weak US jobs data. As inflation reports approach and UBS eyes $5,000, can XAUUSD break resistance at $4,435 to rally toward $4,500?
Author  Naoufal Seddik
Aug 12, Wed
Gold holds above $4,350 following weak US jobs data. As inflation reports approach and UBS eyes $5,000, can XAUUSD break resistance at $4,435 to rally toward $4,500?
placeholder
Gold Price Analysis Today: Gold Drops 1.32% Despite Lower Fed Rate-Hike Bets, Can $4,313 Support Hold? Gold fell 1.32% on August 13 after rising to $4,449.73, then reversing lower and closing near $4,349.918 below the $4,356.46 support. Softer US inflation data reduced Fed rate hike expectations, but selling pressure still dominated the session. Will $4,313 support hold?
Author  Naoufal Seddik
Aug 14, Fri
Gold fell 1.32% on August 13 after rising to $4,449.73, then reversing lower and closing near $4,349.918 below the $4,356.46 support. Softer US inflation data reduced Fed rate hike expectations, but selling pressure still dominated the session. Will $4,313 support hold?
placeholder
Gold Price Analysis Today: Gold Gains 0.94% as Markets Expect Fed to Hold Rates, Can $4,449 Resistance Break? Gold gained 0.94% on August 17, closing near $4,417.30 as softer US data strengthened expectations for unchanged Fed rates in September. Gold remains bullish, with $4,449.730 resistance and $4,310.650 support in focus.
Author  Naoufal Seddik
Aug 18, Tue
Gold gained 0.94% on August 17, closing near $4,417.30 as softer US data strengthened expectations for unchanged Fed rates in September. Gold remains bullish, with $4,449.730 resistance and $4,310.650 support in focus.
placeholder
Gold Price Analysis Today: Gold Rebounds After 1.91% Drop as Yields Ease. Is $4,449 Next? Gold fell about 1.91% on August 18 before producing a strong bullish reaction from the 1-hour demand zone in early August 19 trading. RSI is recovering from oversold conditions, but Supertrend remains bearish as traders await the Fed minutes.
Author  Naoufal Seddik
Aug 19, Wed
Gold fell about 1.91% on August 18 before producing a strong bullish reaction from the 1-hour demand zone in early August 19 trading. RSI is recovering from oversold conditions, but Supertrend remains bearish as traders await the Fed minutes.
goTop
quote