


Cloudflare Inc Stock (NET) Moved Down by 3.69% on Oct 12: What Investors Need To Know
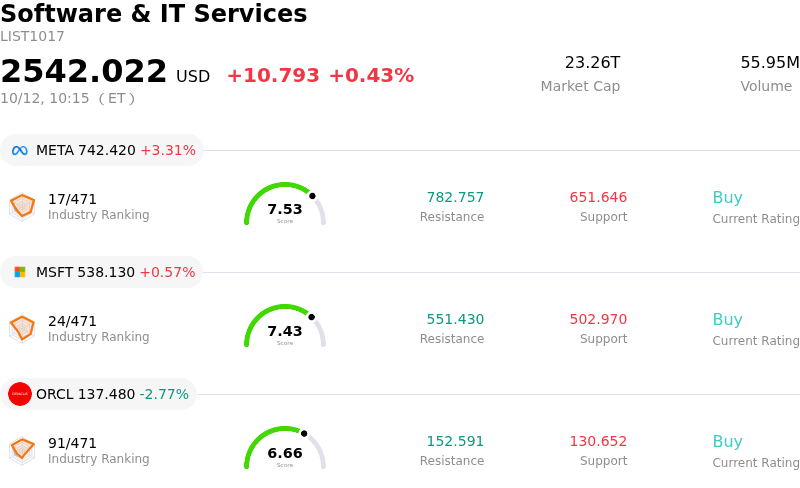
Cloudflare Inc (NET) moved down by 3.69%. The Software & IT Services sector is up by 0.43%. The company underperformed the industry. Top 3 stocks by turnover in the sector: Meta Platforms Inc (META) up 3.32%; Microsoft Corp (MSFT) up 0.56%; Oracle Corp (ORCL) down 2.77%.
What is driving Cloudflare Inc (NET)’s stock price down today?
Cloudflare experienced downward pressure as investors engaged in profit-taking following a powerful multi-week rally that pushed the stock near its 52-week high. The pull-back reflects short-term consolidation after a period of significant momentum fueled by the company's annual Birthday Week product launches, strategic acquisitions, and expanding market adoption of its Workers platform for agentic artificial intelligence workloads. With the equity trading near upper valuation boundaries, market participants trimmed exposure to lock in gains.
Underlying the day's pull-back is elevated sensitivity to valuation metrics across high-growth cloud infrastructure and cybersecurity equities. Cloudflare carries a substantial premium multiple relative to the broader technology sector, leaving the stock vulnerable to re-pricing whenever macro uncertainty or sector-wide volatility emerges. Investors are also exercising caution ahead of the company's upcoming quarterly earnings report, weighing sustained top-line revenue momentum against ongoing net profitability targets and heavy capital allocation toward AI-driven network expansion.
Additionally, institutional portfolio rebalancing and scheduled insider transaction activity contributed to intraday selling pressure. While Wall Street analysts generally maintain a favorable view of Cloudflare's strategic role in internet traffic protection, Zero Trust architecture, and edge computing, short-term market dynamics favored profit realization. The stock's movement reflects healthy market digestion after an extended upward trend rather than structural deterioration in enterprise demand or operational performance.
Technical Analysis of Cloudflare Inc (NET)
Technically, Cloudflare Inc (NET) shows a MACD (12,26,9) value of -4.010, indicating a neutral signal. The RSI at 54.848 suggests neutral condition and the Williams %R at 68.576 suggests sell condition. Please monitor closely.
Fundamental Analysis of Cloudflare Inc (NET)
Cloudflare Inc (NET) is in the Software & IT Services industry. Its latest annual revenue is $2.17B, ranking 121 in the industry. The net profit is $-102.27M, ranking 536 in the industry. Company Profile
Over the past month, multiple analysts have rated the company as Buy, with an average price target of $338.98, a high of $430.00, and a low of $160.00.
More details about Cloudflare Inc (NET)
Company Specific Risks:
- Extreme Valuation Premium and Multiple Compression: Trading at an elevated forward Price-to-Sales ratio near 49x and a forward P/E ratio exceeding 270x, Cloudflare trades at a steep premium relative to historical software sector benchmarks, leaving the equity acutely vulnerable to intraday multiple compression and profit-taking after hitting 52-week highs.
- Persistent Insider Liquidation Overhang: Regulatory disclosures detail massive insider stock sales exceeding $700 million over the past 12 months with zero insider purchases, signaling aggressive profit-taking by leadership near all-time highs and dampening institutional sentiment.
- Sequential Revenue Growth Deceleration: Official Q3 revenue growth projections of 30% to 31% year-over-year represent a sequential deceleration from the 35.9% expansion delivered in Q2, creating execution risks for institutional investors expecting sustained upper-30s growth to support its valuation narrative.
- Container Architecture Security Vulnerabilities: Technical disclosures detailing a cross-tenant data-isolation flaw within Cloudflare's Containers and Sandboxes architecture—exposing potential residual disk data access in shared host environments—raise persistent reputational and enterprise trust risks.
Recommended Articles


