


USD/CHF (USDCHF) Is up 0.50% on Oct 12: What Is Driving the Move?
USD/CHF (USDCHF) is up 0.50% at Oct 12 10:20(ET), now at $0.8337, with a 7-day up of 0.46%.
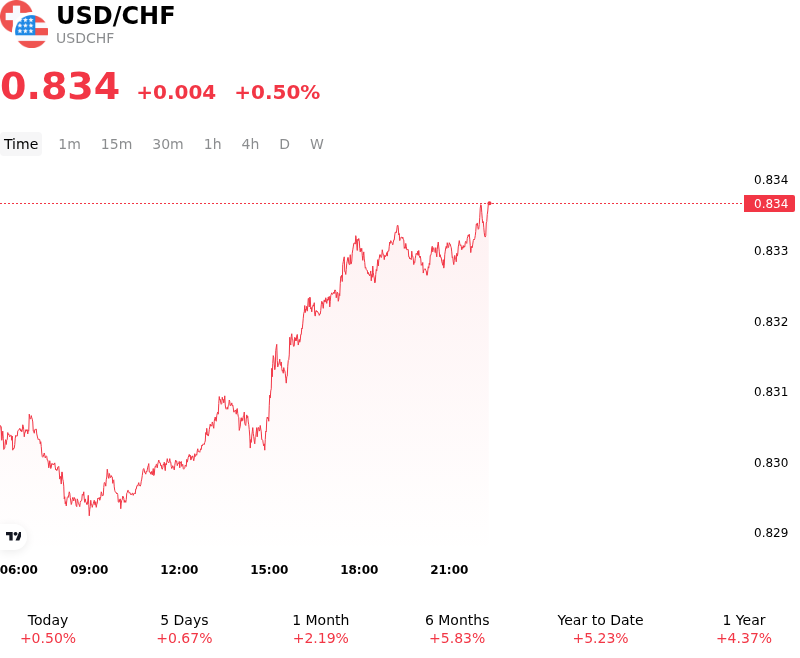
What is driving USD/CHF (USDCHF)’s stock price up today?
The advance in USDCHF reflects expanding monetary policy divergence and favorable short-term interest-rate differentials favoring the U.S. dollar over the Swiss franc. While the Swiss National Bank has maintained its benchmark policy rate at 0% amid low domestic core inflation and modest growth forecasts, the Federal Reserve continues to maintain a significantly tighter stance, backed by market expectations of potential additional policy firming before year-end. This expanding yield spread between U.S. Treasuries and Swiss government bonds continues to incentivize capital flows away from low-yielding Swiss franc assets and into higher-yielding dollar instruments, creating sustained support for the base currency.
Geopolitical developments and commodity market fluctuations also exerted an asymmetric influence on the currency pair. Rebounding global oil prices reinforced domestic U.S. inflation risks, underpinning U.S. bond yields and strengthening the argument for sustained monetary restraint by the Federal Reserve. Concurrently, higher energy import costs pose margin pressures on European economies, including Switzerland. Although geopolitical friction often sparks defensive safe-haven demand for the Swiss franc, the dollar's substantial yield premium and global liquidity profile allowed it to outshine the franc, muting the typical safe-haven flows into CHF.
From a positioning and technical perspective, institutional market dynamics provided additional upward momentum. Aggressive short positioning on the franc, driven by the SNB's accommodative policy posture, left the currency vulnerable to continued underperformance against major high-yielding peers. In technical trading, spot prices holding above key short-term exponential moving averages encouraged momentum-based buying, driving the pair toward the upper boundaries of its recent consolidation range. Investors will remain focused on upcoming U.S. consumer price data and central bank speeches to evaluate whether the move represents a broader macro breakout or a continuation of range-bound price action.
Technical Analysis of USD/CHF (USDCHF)
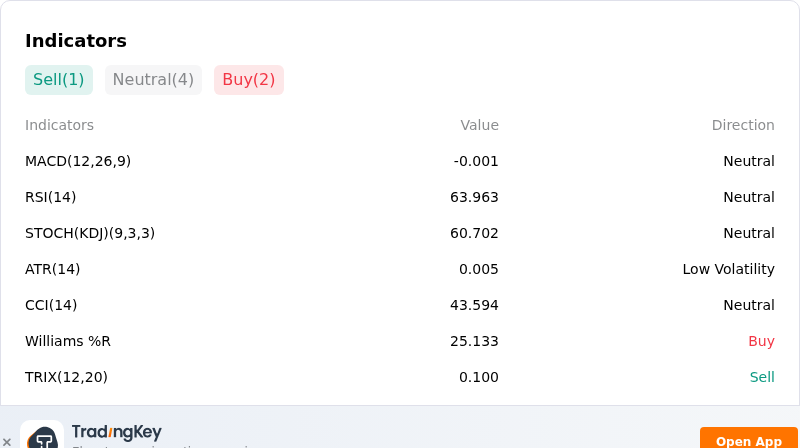
Technically, USD/CHF (USDCHF) shows a MACD (12,26,9) value of -0.001, indicating a neutral signal. The RSI at 63.963 suggests neutral condition and the Williams %R at 25.133 suggests buy condition. Please monitor closely.
More details about USD/CHF (USDCHF)
Recent Events and Risks:
- U.S. Treasury Yield Pullback: A recent pullback in U.S. Treasury yields from local highs has eroded the Greenback's yield premium over the zero-yielding Swiss Franc, triggering downside corrective pressure on USD/CHF.
- Safe-Haven Inflows Driven by Geopolitical Escalation: Escalating military conflicts in the Middle East and attacks on Ukrainian energy infrastructure have heightened global risk aversion, driving direct safe-haven capital flows into the Swiss Franc.
- Deteriorating U.S. Macroeconomic Sentiment: The unexpected decline in the University of Michigan Consumer Sentiment Index to 46.3 has renewed concerns over U.S. economic momentum, tempering aggressive Federal Reserve rate expectations and weighing on USD demand.
- Technical Reversal at Key Resistance: USD/CHF experienced a sharp rejection at the 0.8375–0.8387 resistance confluence, displaying an outside-day bearish reversal and momentum divergence that leaves the pair vulnerable to deeper corrective pullbacks toward 0.8260.
Recommended Articles


