


Bitcoin Price Forecast: BTC slips below $83,000 amid ETF outflows, macro headwinds
- Bitcoin extends its decline, trading below $83,000 on Thursday, correcting 4% so far this week.
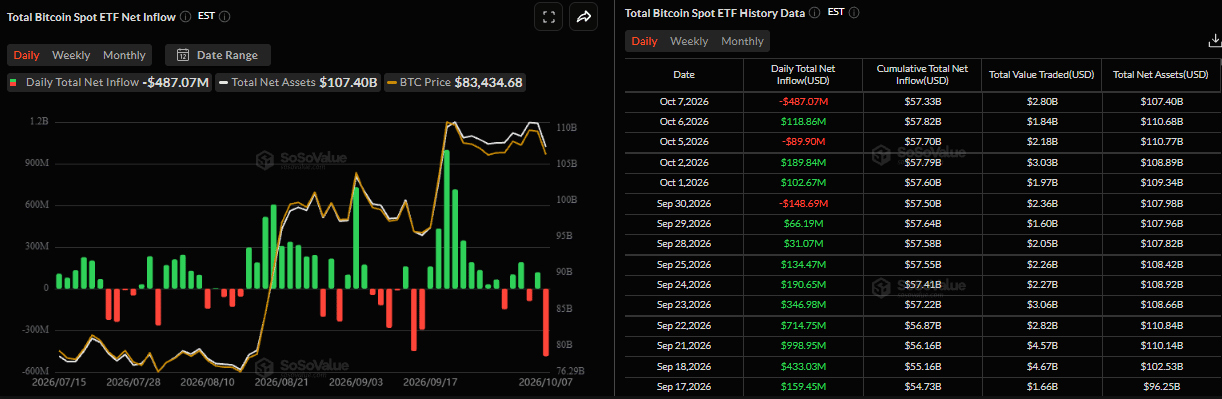
- US-listed spot ETFs recorded $487.07 million in outflows on Wednesday, marking the highest single-day withdrawals since June 25.
- Hawkish Fed, elevated US Treasury yields, and rising geopolitical risks continue to weigh on BTC.
Bitcoin (BTC) remains under pressure, trading below $83,000 at the time of writing on Thursday, down over 4% so far this week. Institutional demand has supported this weakness, with spot Exchange Traded Funds (ETFs) recording outflows of over $487 million on Wednesday, the highest single-day withdrawals since June 25. Meanwhile, broader macroeconomic headwinds weigh on sentiment, pressuring Crypto King’s price.
Institutional demand shows cooling signs
Institutional demand shows early signs of weakening so far this week. SoSoValue data showed that spot ETFs recorded $487.07 million in outflows on Wednesday, marking the highest single-day withdrawals since June 25. Moreover, if this outflow trend continues and intensifies throughout the week, BTC could see further correction.
On-chain activity also points to a cautious outlook. Lookonchain reported on X on Thursday that US government-linked wallets transferred another $566 million worth of assets over the past 10 hours (4,632 BTC, 119 million USDT and 750 WBTC). Most of the funds were moved to Coinbase Prime, potentially increasing short-term selling pressure.
In addition, long-dormant Bitcoin whales are becoming active. Another whale transferred 4,500 BTC on Thursday after more than four years of inactivity. If these funds are moved to an exchange, it could signal potential selling pressure and weigh further on BTC’s price.
Hawkish Fed and soaring yields cap BTC bulls
On the macroeconomics front, a stronger US Dollar (USD) and soaring 10-year US Treasury yield further cap the upside momentum for Crypto King.
The US Dollar Index (DXY) reached an intraday high of $102.53 on Monday, reaching levels not seen since early April 2025 and has stabilized around $102.36 on Thursday. Similarly, the 10-year US Treasury yield rose and posted a fresh two-decade high this week, now holding strong around 5.30%. These higher yields make traditional fixed-income assets more attractive than risky assets.
Moreover, Federal Open Market Committee (FOMC) Minutes of the September 15-16 meeting revealed that the committee voted unanimously to raise the federal funds rate target range. Most officials expect that another rate increase would likely be appropriate by year-end to combat persistent inflation, further supporting US bond yields and the USD, which caps the Crypto King.
Elevated geopolitical tensions dampen risk appetite
On the geopolitical front, the Pentagon reportedly told US Central Command (CENTCOM) several days ago to conclude preparations for resuming major combat operations in Iran as US President Donald Trump weighs a specific date for launching strikes.
The US and Israeli sources said that US attacks could happen before America's midterm elections and possibly the Israeli elections due a week earlier. This, in turn, could continue to benefit the safe-haven USD, dampen risk appetite and weigh on BTC.
Bitcoin technical outlook: Closes below $85,000 support
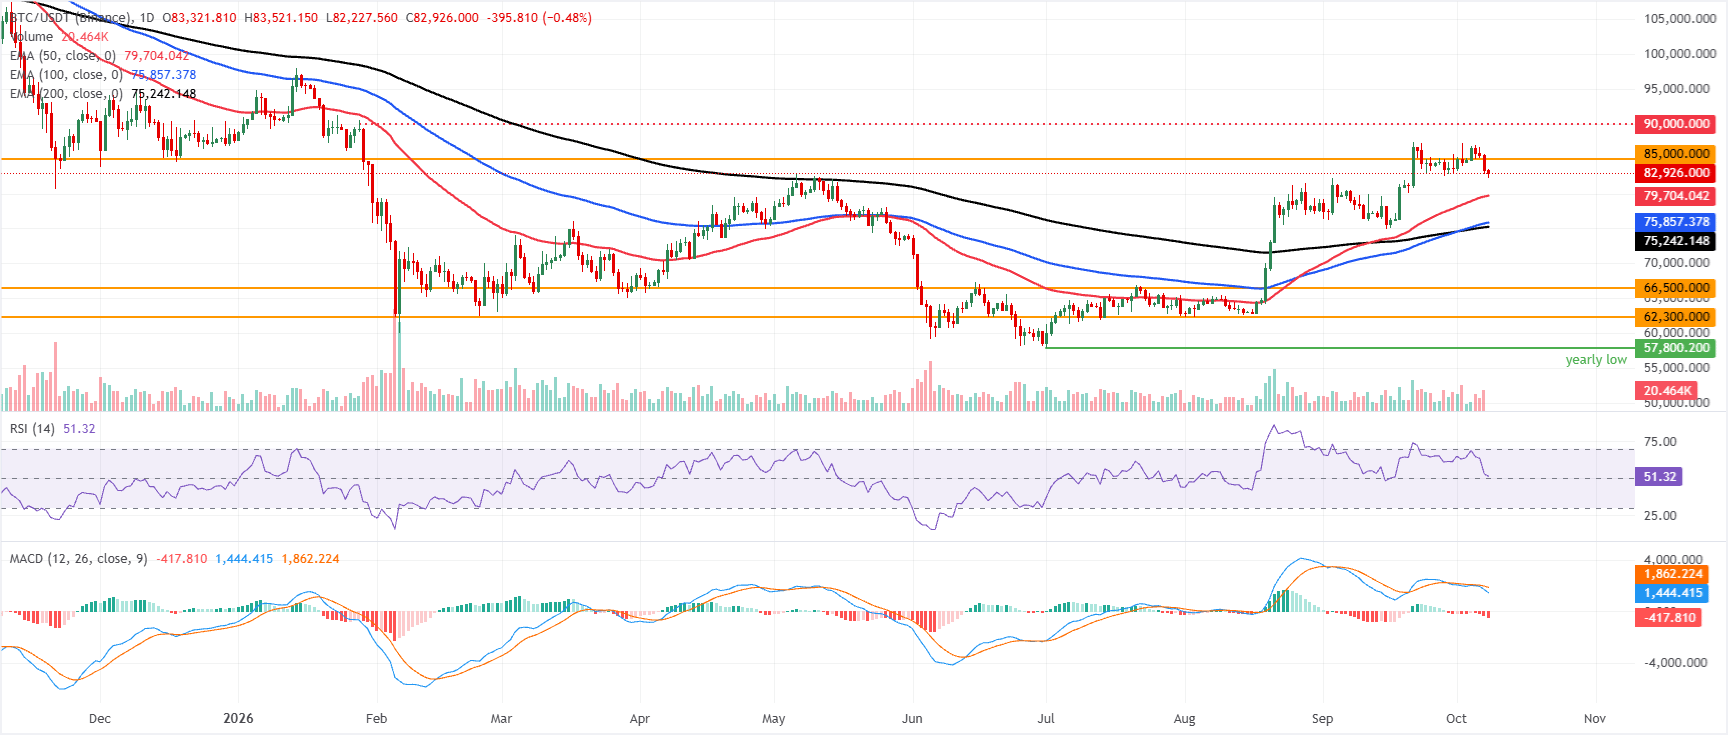
Bitcoin price trades at $82,926 on Thursday, falling over 4% so far this week. BTC failed to surpass the recent highs around $87,000 and closed below the key $85,000 support the previous day.
Despite the pullback, BTC remains broadly bullish, holding well above the 50-day, 100-day, and 200-day Exponential Moving Averages (EMAs) clustered between roughly $79,700 and $75,200.
The Relative Strength Index (RSI) sits near a neutral 51, suggesting consolidation after the recent advance. At the same time, the Moving Average Convergence Divergence (MACD) histogram is negative, hinting that upside momentum is moderating rather than reversing at this stage.
On the topside, immediate resistance is located at the horizontal barrier at $85,000, where a clear daily close above would reopen the path toward the recent highs around $87,000.
On the downside, initial demand is seen at the 50-day EMA near $79,704, followed by the 100-day EMA at $75,857 and the 200-day EMA at $75,242, which together define a broad structural support band; deeper pullbacks would expose the previous horizontal floors at $66,500 and $62,300.
(The technical analysis of this story was written with the help of an AI tool. Know more.)
Bitcoin, altcoins, stablecoins FAQs
Bitcoin is the largest cryptocurrency by market capitalization, a virtual currency designed to serve as money. This form of payment cannot be controlled by any one person, group, or entity, which eliminates the need for third-party participation during financial transactions.
Altcoins are any cryptocurrency apart from Bitcoin, but some also regard Ethereum as a non-altcoin because it is from these two cryptocurrencies that forking happens. If this is true, then Litecoin is the first altcoin, forked from the Bitcoin protocol and, therefore, an “improved” version of it.
Stablecoins are cryptocurrencies designed to have a stable price, with their value backed by a reserve of the asset it represents. To achieve this, the value of any one stablecoin is pegged to a commodity or financial instrument, such as the US Dollar (USD), with its supply regulated by an algorithm or demand. The main goal of stablecoins is to provide an on/off-ramp for investors willing to trade and invest in cryptocurrencies. Stablecoins also allow investors to store value since cryptocurrencies, in general, are subject to volatility.
Bitcoin dominance is the ratio of Bitcoin's market capitalization to the total market capitalization of all cryptocurrencies combined. It provides a clear picture of Bitcoin’s interest among investors. A high BTC dominance typically happens before and during a bull run, in which investors resort to investing in relatively stable and high market capitalization cryptocurrency like Bitcoin. A drop in BTC dominance usually means that investors are moving their capital and/or profits to altcoins in a quest for higher returns, which usually triggers an explosion of altcoin rallies.
Recommended Articles


