


Dollar Index flatlines as Fed Governor Waller puts no date on more hikes
- DXY flatlines under 102.50, its third stall in four sessions, as Fed Governor Waller speaks.
- Futures price an October hike near one in five and December near 80%.
- Each of the three highs came with the Euro just above 1.1150, near a 17-month low.
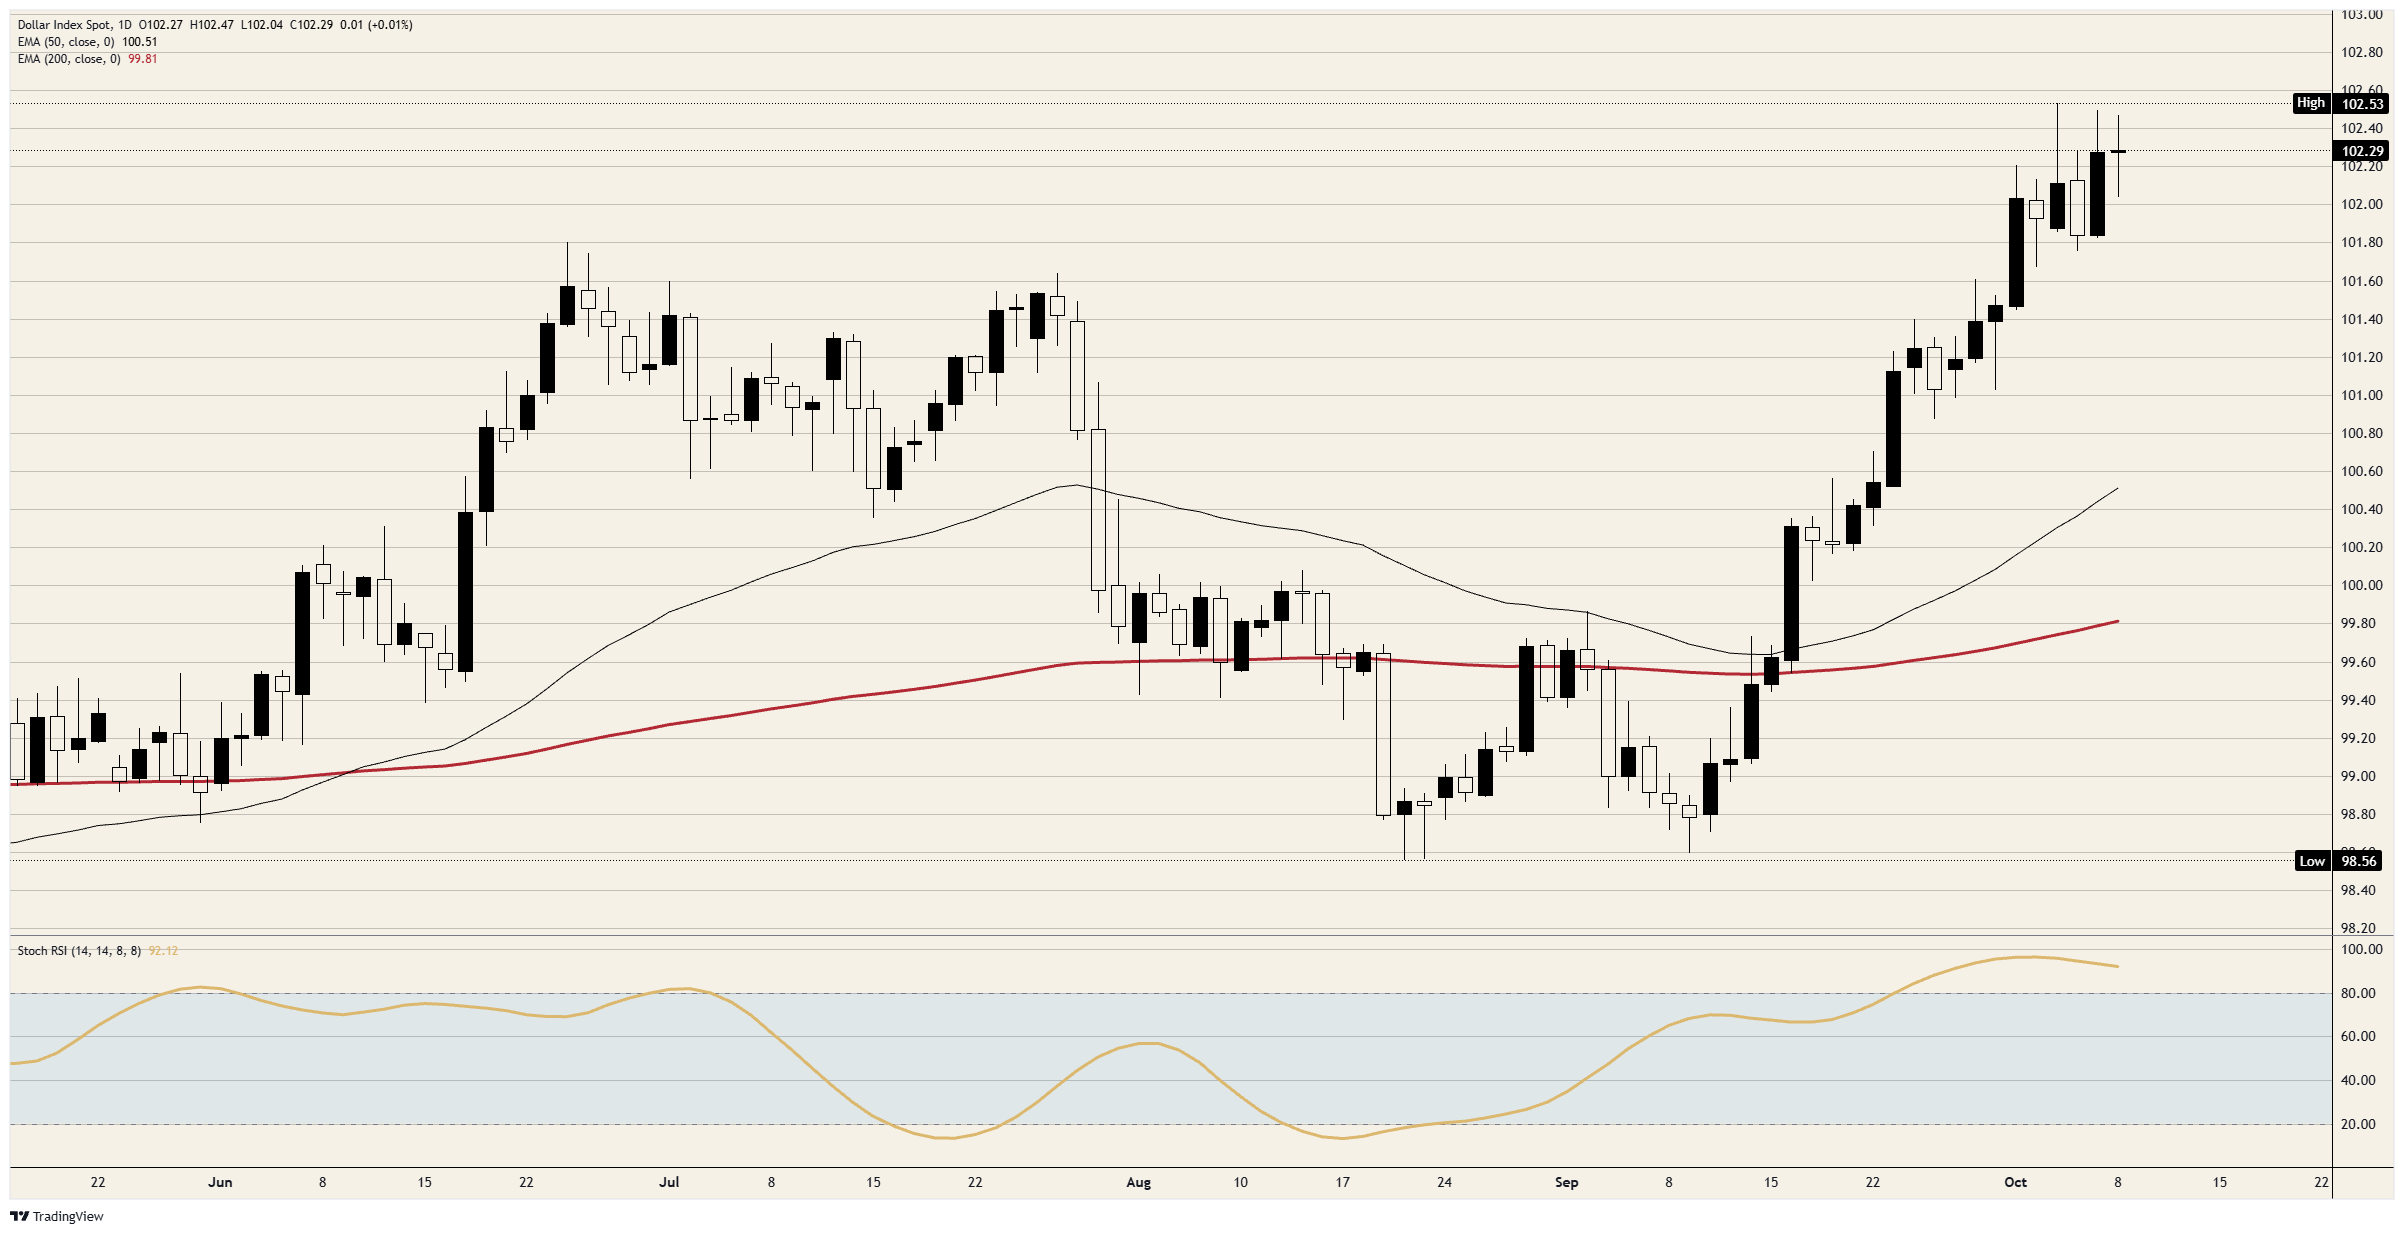
102.50 has stopped the Dollar Index on Monday, Wednesday and Thursday, and a call for more rate hikes from Fed Governor Waller on Thursday didn't get it any further. The index trades near 102.30, inside the range it has held since October 1. A 10-year Treasury yield near 5.30% and another round of selling in European government bonds left it there too.
Fed Governor Waller asks for the hikes already priced
The Fed raised its rate to 3.75%-4.00% on September 16 in a unanimous vote, and minutes released on Wednesday showed most policymakers expect another increase by year-end and nearly all see the risks to inflation tilted higher. In Istanbul on Thursday, Governor Waller said more hikes are likely needed to get inflation back to 2% sooner, and that they don't need to come at consecutive meetings.
Governor Waller also said inflation has run above the Fed's target for close to five and a half years, and that he isn't greatly concerned higher rates will slow the economy much. He named higher technology prices from the artificial intelligence build-out and the threat of new tariffs as the pressures still pushing inflation up. The two-year Treasury yield, the one most tied to the Fed's next moves, is near 4.80%, about 0.80 points above the top of the Fed's range.
Futures price about a one-in-five chance of a hike at the October 27-28 meeting and close to 80% for December 8-9, which is the path he described. The index rose toward 102.50 after he spoke, stopped short of Monday's high, and later dipped to just above 102.00 before climbing back. More hikes at no particular meeting describes what futures already price rather than changing it.
The index's ceiling is the Euro's floor
The Euro makes up 57.6% of the Dollar Index, and the index's highs on Monday, Wednesday and Thursday each came in the same quarter-hour as the Euro's low against the Dollar, every time just above 1.1150. That is the Euro's weakest level since May 2025, so a Euro break below it is what would take the index through 102.50. Below 1.1150, the next level the Euro has traded is its May 2025 low just above 1.1050.
French government debt is what keeps the Euro near that floor. France's 10-year yield is near 4.90%, against 3.50% in Germany and close to the two-decade high above 5% it reached earlier in October. The selling has spread to Italian and Greek bonds ahead of France's 2027 presidential election.
The government's 2027 budget aims to cut the deficit to 5% of national output, and France's fiscal watchdog called its economic assumptions optimistic. Unions have called another strike for October 13, and German Finance Minister Klingbeil said on Thursday he is in touch with his French counterparts on bonds.
The European Central Bank (ECB) is now expected to raise rates twice more by March 2027, which limits how far the gap between US and euro-area rates can widen. Brent is heading for its largest daily gain in a month, and the Euro, the currency of a bloc that buys nearly all of its Crude Oil abroad, has stayed inside its range.
Governor Waller's worry is on Friday's calendar
The worry Governor Waller named on Thursday is that the recent pickup in inflation could raise what households and businesses expect it to be. The University of Michigan (UoM) survey on Friday at 14:00 GMT carries that measure, with one-year inflation expectations at 4.6% in September and five-year expectations at 3.4%.
The New York Fed's own survey, published on Wednesday, put one-year expectations at 3.9% in September, up from 3.6% in August. Jobless claims came in at 197K on Thursday against a 200K forecast, which fits his view that the labour market is stable and leaves inflation as the only case for an earlier hike.
A one-year reading above 4.6% is the result that could take the index through 102.50, and a softer one leaves December as the only meeting priced. It's possible one survey of household expectations pulls the next hike forward six weeks, from December 9 to October 28. Futures give that one chance in five, and nothing in Thursday's speech raised it.
Levels and bias
Resistance: 102.50 stopped the index on Monday, Wednesday and Thursday, and Monday's high just above it is the highest since April 2025. 103.00 is the next round level above.
Support: Buyers stepped in just above 102.00 on Thursday's dip. Every low since October 1 has held above 101.50, where the late-September range topped out.
Bias: The lean is short while 102.50 caps, aiming first at 102.00 and then at 101.50. On the daily chart the Stochastic Relative Strength Index (Stoch RSI) reads about 92 and is falling from the top of its range. The short is wrong on a daily close above 102.50, which would put 103.00 in play.
DXY daily chart
US Dollar FAQs
The US Dollar (USD) is the official currency of the United States of America, and the ‘de facto’ currency of a significant number of other countries where it is found in circulation alongside local notes. It is the most heavily traded currency in the world, accounting for over 88% of all global foreign exchange turnover, or an average of $6.6 trillion in transactions per day, according to data from 2022. Following the second world war, the USD took over from the British Pound as the world’s reserve currency. For most of its history, the US Dollar was backed by Gold, until the Bretton Woods Agreement in 1971 when the Gold Standard went away.
The most important single factor impacting on the value of the US Dollar is monetary policy, which is shaped by the Federal Reserve (Fed). The Fed has two mandates: to achieve price stability (control inflation) and foster full employment. Its primary tool to achieve these two goals is by adjusting interest rates. When prices are rising too quickly and inflation is above the Fed’s 2% target, the Fed will raise rates, which helps the USD value. When inflation falls below 2% or the Unemployment Rate is too high, the Fed may lower interest rates, which weighs on the Greenback.
In extreme situations, the Federal Reserve can also print more Dollars and enact quantitative easing (QE). QE is the process by which the Fed substantially increases the flow of credit in a stuck financial system. It is a non-standard policy measure used when credit has dried up because banks will not lend to each other (out of the fear of counterparty default). It is a last resort when simply lowering interest rates is unlikely to achieve the necessary result. It was the Fed’s weapon of choice to combat the credit crunch that occurred during the Great Financial Crisis in 2008. It involves the Fed printing more Dollars and using them to buy US government bonds predominantly from financial institutions. QE usually leads to a weaker US Dollar.
Quantitative tightening (QT) is the reverse process whereby the Federal Reserve stops buying bonds from financial institutions and does not reinvest the principal from the bonds it holds maturing in new purchases. It is usually positive for the US Dollar.
Recommended Articles


