

Pi Network Price Forecast: PI halts decline at key support amid easing retail support

Source Fxstreet
  • PI Network is up nearly 2% on Thursday, ticking higher after a roughly 7% decline the previous day.
  • PI futures Open Interest declines to $8.94 million, suggesting reduced risk appetite.
  • The technical outlook for PI is bearish, as downside momentum prevails.

Pi Network (PI) price is up nearly 2% on Thursday, ticking higher after seven consecutive bearish daily closes, including a 7% decline the previous day. Despite the mild recovery, retail support is lacking as PI futures Open Interest declines to $8.94 million, from $10.38 million the previous day. The technical outlook for the PI token is bearish as downside pressure mounts on the $0.0800 support level.

Pi Network is losing retail demand despite elevated social chatter

Pi Network futures witness a decline in the notional value of all open positions. CoinAnk data shows the PI futures Open Interest (OI) down to $8.94 million from $10.38 million the previous day, suggesting a reduced value due to a spot price decline or a possible positional wipeout. 

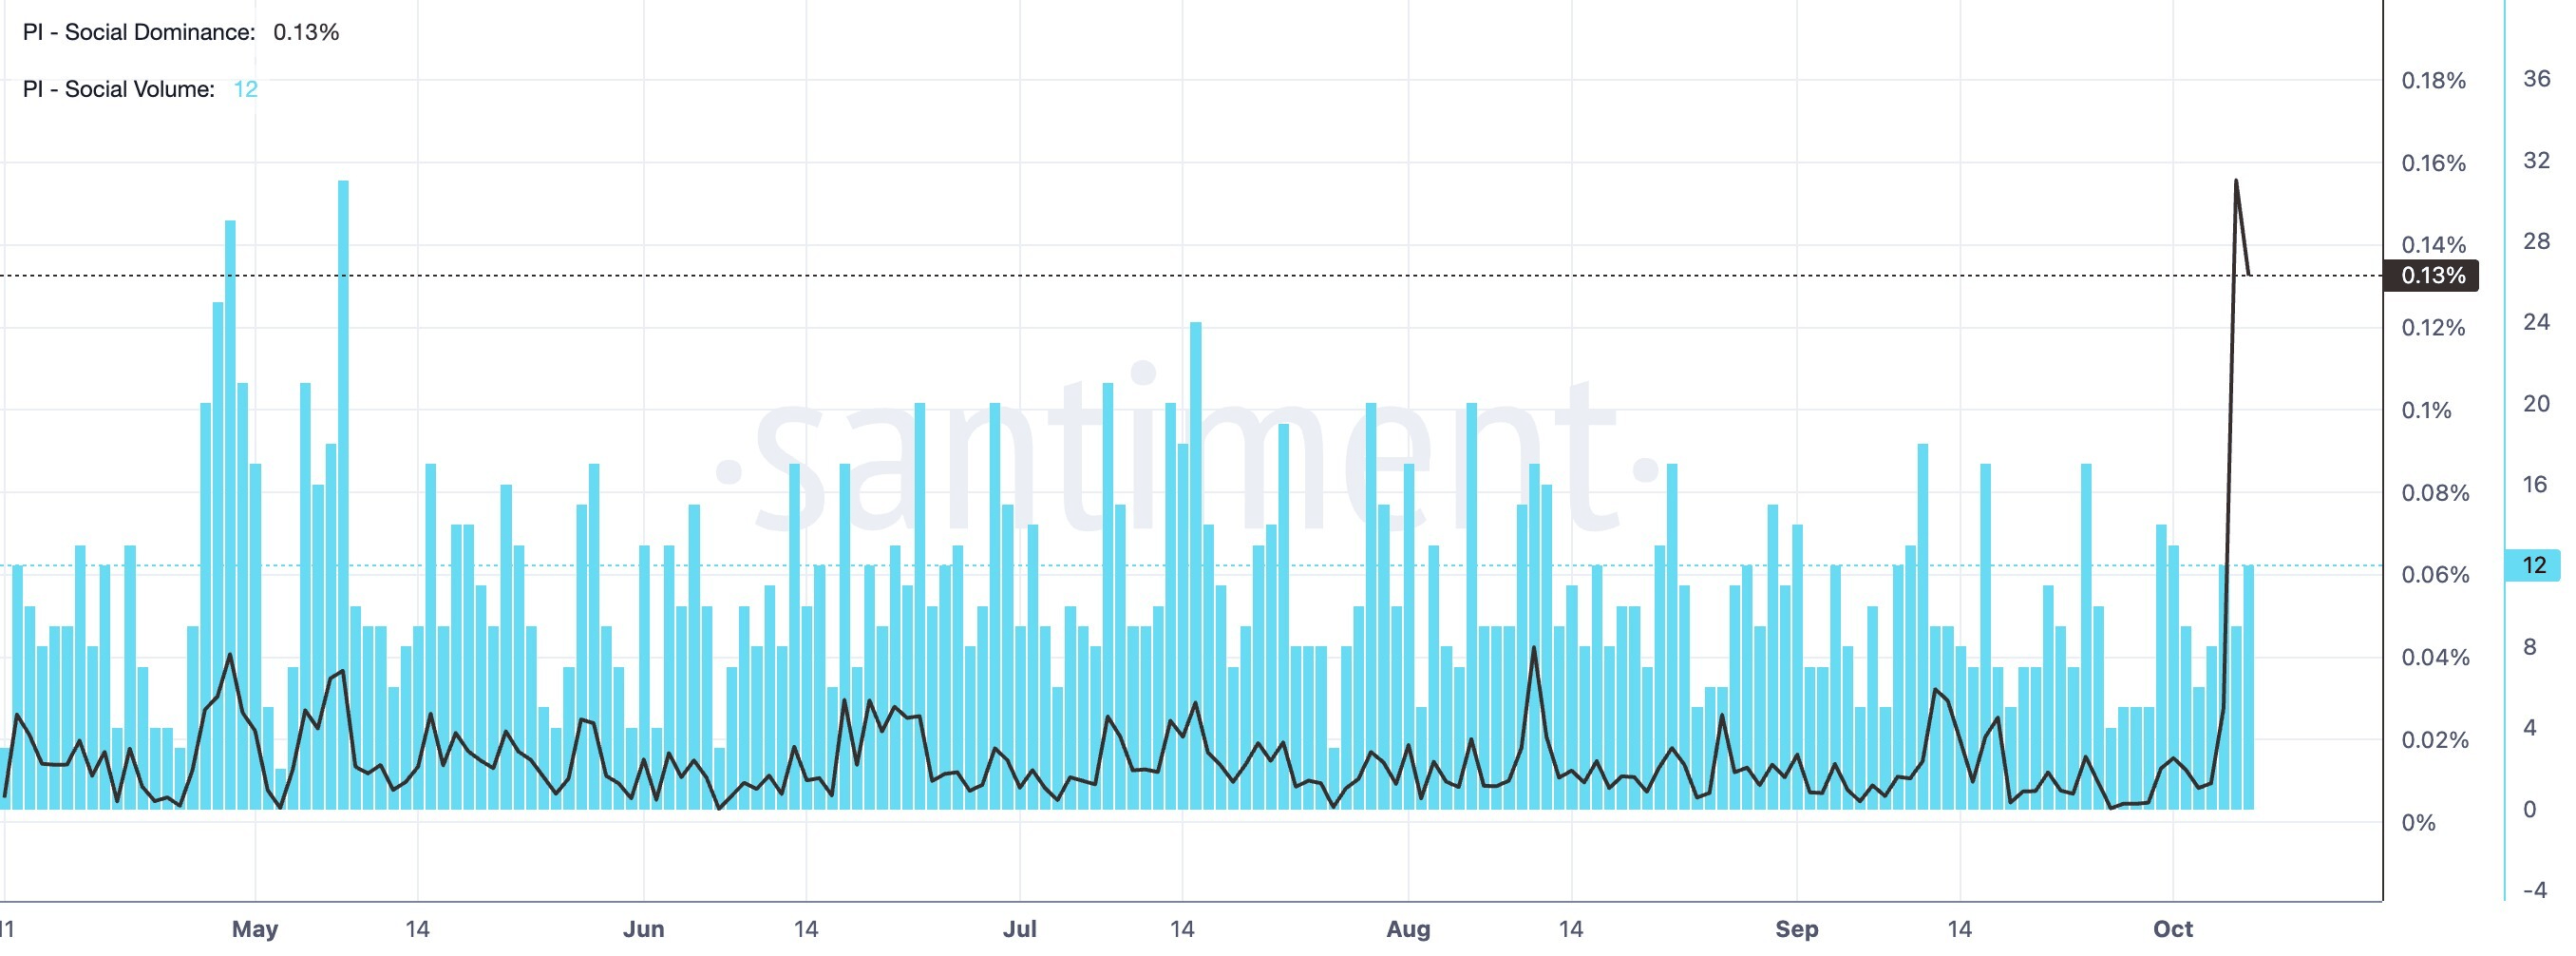
On the other hand, Santiment data shows elevated social buzz for the PI token, with the social dominance score at 0.13%, after a surge to 0.14% the previous day.
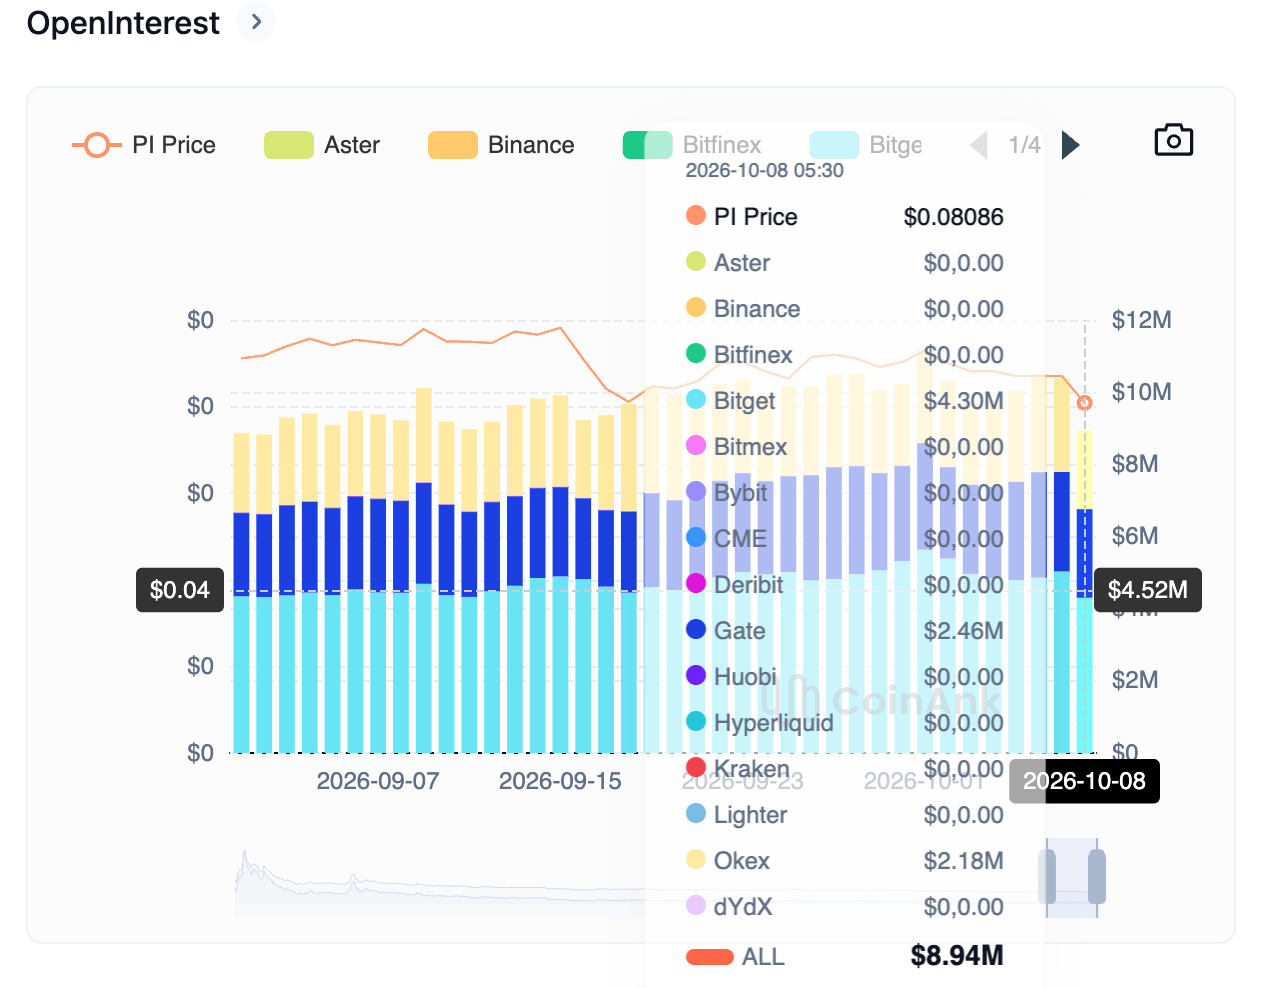
PI token Open Interest chart. Source: CoinAnk
PI social interest data. Source: Santiment

Technical outlook: Pi Network hints at a rebound

Pi Network trades around $0.0823 at press time on Thursday, extending a mild rebound from the $0.0801 support level set by the July 31 low. The PI token maintains a bearish near-term tone as it holds beneath both the 50-day and 200-day Exponential Moving Averages (EMAs) at $0.0902 and $0.1247, respectively.

From a technical perspective, PI trades below the 23.6% Fibonacci retracement at $0.0827, measured from $0.1341 to $0.0704, keeping the broader downside bias intact. For a sustained recovery, PI must reclaim the $0.0827 level, which could pave the path toward the 50-day EMA at $0.0902.

Momentum remains soft on the daily chart, with the Relative Strength Index (RSI) around 38, suggesting firm selling pressure rather than outright oversold conditions. At the same time, the Moving Average Convergence Divergence (MACD) line declines below the signal line into the negative territory, hinting that bearish momentum is gaining strength.

Chart Analysis PI/USD (baha Crypto)
PI/USD daily price chart.

On the downside, the only nearby structural support is at the July 31 low of $0.0801, guarding the Fibonacci anchor around $0.0704, where buyers may attempt to build a more durable floor.

(The technical analysis of this story was written with the help of an AI tool. Know more.)

Disclaimer: For information purposes only. Past performance is not indicative of future results.
placeholder
XRP Price Prediction for July 2026: Can Buyers Finally Break the Downtrend?XRP (XRP) price trades near $1.05, caught between a year-long downtrend and a sudden burst of buying.July has historically rewarded XRP holders. This year the month arrives with on-chain accumulation
Author  Beincrypto
Jun 30, Tue
XRP (XRP) price trades near $1.05, caught between a year-long downtrend and a sudden burst of buying.July has historically rewarded XRP holders. This year the month arrives with on-chain accumulation
placeholder
NVIDIA Price Forecast: Michael Burry Shorts NVDA, but Analysts See $299On July 1, NVIDIA (NASDAQ: NVDA) sits at $198.34, failing to break above the former support level that is now serving as resistance between $198 and $205 on the 2H chart's downward blue c
Author  TradingKey
Jul 02, Thu
On July 1, NVIDIA (NASDAQ: NVDA) sits at $198.34, failing to break above the former support level that is now serving as resistance between $198 and $205 on the 2H chart's downward blue c
placeholder
XAUUSD Gold Analysis: Gold Holds Above $4,350 Ahead of US Inflation Data Is $4,500 Next? Gold holds above $4,350 following weak US jobs data. As inflation reports approach and UBS eyes $5,000, can XAUUSD break resistance at $4,435 to rally toward $4,500?
Author  Naoufal Seddik
Aug 12, Wed
Gold holds above $4,350 following weak US jobs data. As inflation reports approach and UBS eyes $5,000, can XAUUSD break resistance at $4,435 to rally toward $4,500?
placeholder
Gold Price Analysis Today: Gold Drops 1.32% Despite Lower Fed Rate-Hike Bets, Can $4,313 Support Hold? Gold fell 1.32% on August 13 after rising to $4,449.73, then reversing lower and closing near $4,349.918 below the $4,356.46 support. Softer US inflation data reduced Fed rate hike expectations, but selling pressure still dominated the session. Will $4,313 support hold?
Author  Naoufal Seddik
Aug 14, Fri
Gold fell 1.32% on August 13 after rising to $4,449.73, then reversing lower and closing near $4,349.918 below the $4,356.46 support. Softer US inflation data reduced Fed rate hike expectations, but selling pressure still dominated the session. Will $4,313 support hold?
placeholder
Gold Price Analysis Today: Gold Gains 0.94% as Markets Expect Fed to Hold Rates, Can $4,449 Resistance Break? Gold gained 0.94% on August 17, closing near $4,417.30 as softer US data strengthened expectations for unchanged Fed rates in September. Gold remains bullish, with $4,449.730 resistance and $4,310.650 support in focus.
Author  Naoufal Seddik
Aug 18, Tue
Gold gained 0.94% on August 17, closing near $4,417.30 as softer US data strengthened expectations for unchanged Fed rates in September. Gold remains bullish, with $4,449.730 resistance and $4,310.650 support in focus.
goTop
quote