


Ethereum Price Forecast: Leverage capital cools to lowest level since March amid consolidation
Ethereum price today: $2,680
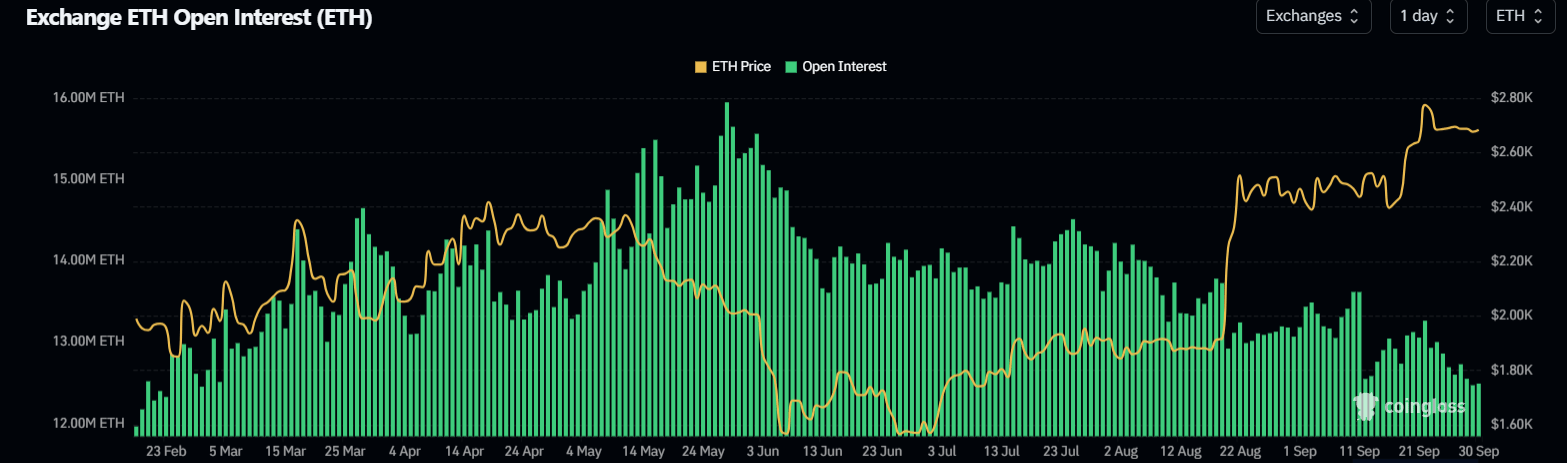
- Ethereum open interest declined to 12.49 million ETH on Wednesday, its lowest level since March.
- While the decline in open interest reflects fading demand, it could also support price action.
- ETH remains trading in the $2.62K-$2.78K range.
Ethereum (ETH) remains range-bound on Wednesday, with leverage capital continuing to dwindle despite lower-than-expected inflation data.
Open interest contracts as derivatives stay muted
Open interest, the total value of outstanding contracts in a derivatives market, in the top altcoin has trended down over the past week, reaching 12.49 million ETH, its lowest level since March 1.
Despite price strength over the past three months, leverage has failed to expand in line with it. Since ETH began its recovery in early July, open interest has dropped by 1.46 million ETH.
The Taker Buy Sell Ratio, which measures the proportion of buying relative to selling volume of traders using market orders (immediate market sentiment) in ETH perpetuals, has also largely hovered in negative territory since last week. The move indicates that perpetual traders are slightly leaning negative even as prices consolidate.
-1790810091151.png)
Ethereum futures is telling a similar story to Bitcoin futures, with open interest down 49,000 BTC over the past seven days.
On Monday, the CME saw a single-day OI drop of 16,075 BTC, its third-largest daily decline on record, according to Bitfinex analysts in a Wednesday report. The drop comes alongside contracting futures premiums in these contracts.
"This combination of contracting OI in response to diminished futures premiums has historically supported price action," wrote Bitfinex. "Since 2022, elevated futures settlement ratios paired with compressed carry have preceded a median 30-day gain of 8.9 percent [in BTC]."
At the same time, the analysts highlighted that the drop in OI indicates traders are closing positions to take profits, while demand is fading.
"The same OI decline can also be read as fading demand. The failure of bitcoin-denominated OI to expand alongside price signals a lack of speculative appetite and persistent profit-taking," Bitfinex added. "Both interpretations are correct as they describe different things. Low leverage limits the scope for a price decline to accelerate through liquidations, but it does not create a buyer. That buyer must come from the spot market."
Meanwhile, US spot ETH exchange-traded funds (ETFs) broke their seven-day inflow streak on Tuesday, after recording minor net outflows of $2.8 million, per SoSoValue data.
Following the outflows, US August Personal Consumption Expenditures (PCE) inflation data, the Federal Reserve's (Fed) preferred inflation metric, fell to 3.4% MoM, below expectations of 3.7%. Core PCE dropped to 3.0%, below forecasts of 3.3%.
Ethereum technical outlook: ETH stays in $2.62K-$2.78K range
Ethereum has seen $56.8 million in liquidations over the past 24 hours, led by $32 million in long liquidations, per Coinglass data.
On the daily chart, ETH maintains a bullish bias as it holds above all key Exponential Moving Averages (EMAs). Momentum remains constructive, as the 14-day Relative Strength Index (RSI) sits near 62 and the Stochastic Oscillator (Stoch) around 67, suggesting positive but not yet overextended buying pressure after the latest advance.
On the downside, immediate support is at the horizontal level near $2,626, closely aligned with the 20-day EMA at $2,619, forming a nearby demand cluster, before $2,545 and $2,432. Deeper pullbacks would expose the medium-term EMA base between the 50-day EMA at $2,447 and the 200-day EMA at $2,313, ahead of structural floors at $2,172 and $1,961.
-1790810235456.png)
On the topside, the next significant resistance is located at $2,787, where a break higher would open the way toward $2,880 and $3,088,
(The technical analysis of this story was written with the help of an AI tool. Know more.)
Recommended Articles


