


EUR/CHF Price Forecast: 100-day SMA limits immediate downside
- EUR/CHF trades on the back foot as France’s fiscal troubles weigh on the Euro.
- The cross trades below the 50-day SMA, while the 100-day SMA near 0.9297 offers initial support.
- A bearish MACD crossover and RSI near 36 point to growing selling pressure.
EUR/CHF holds modest losses on Monday as growing fiscal concerns in France weigh on the Euro (EUR). However, the cross has reversed most of its intraday decline as buying interest in the Swiss Franc (CHF) remains limited due to Switzerland’s wide interest-rate gap with other major economies and the Swiss National Bank’s (SNB) readiness to counter excessive Franc strength. At the time of writing, EUR/CHF trades around 0.9318 after hitting an intraday low of 0.9272.
Euro pressured as France fiscal strains complicate ECB backstop
Strategists at Brown Brothers Harriman note that the Euro is lagging its peers, with “EUR is underperforming all major currencies, with EUR/USD dropping briefly to an intra-day low at 1.1161, its lowest level since May 2025.” They highlight that “France’s budget crisis is spilling into other Eurozone sovereign bond markets, widening yield spreads to Germany,” amplifying concerns around fiscal risk across the bloc.
BBH points out that the ECB’s Transmission Protection Instrument “provides a backstop against disorderly spread widening, but activation is contingent on EU member state pursuing ‘sound and sustainable fiscal and macroeconomic policies.’” In their view, “France's deteriorating finances complicate the case for intervention, although broader contagion would increase pressure on the ECB to act.”
At the same time, BBH notes that ECB Chief Economist Philip Lane has underlined that the “increase in long-term interest rates constitutes a material tightening of financial conditions for the euro area.” Taken together, they argue this leaves the Euro “facing downside pressure from both rising fiscal risk and a potentially shallower ECB hiking cycle.”
Technical analysis
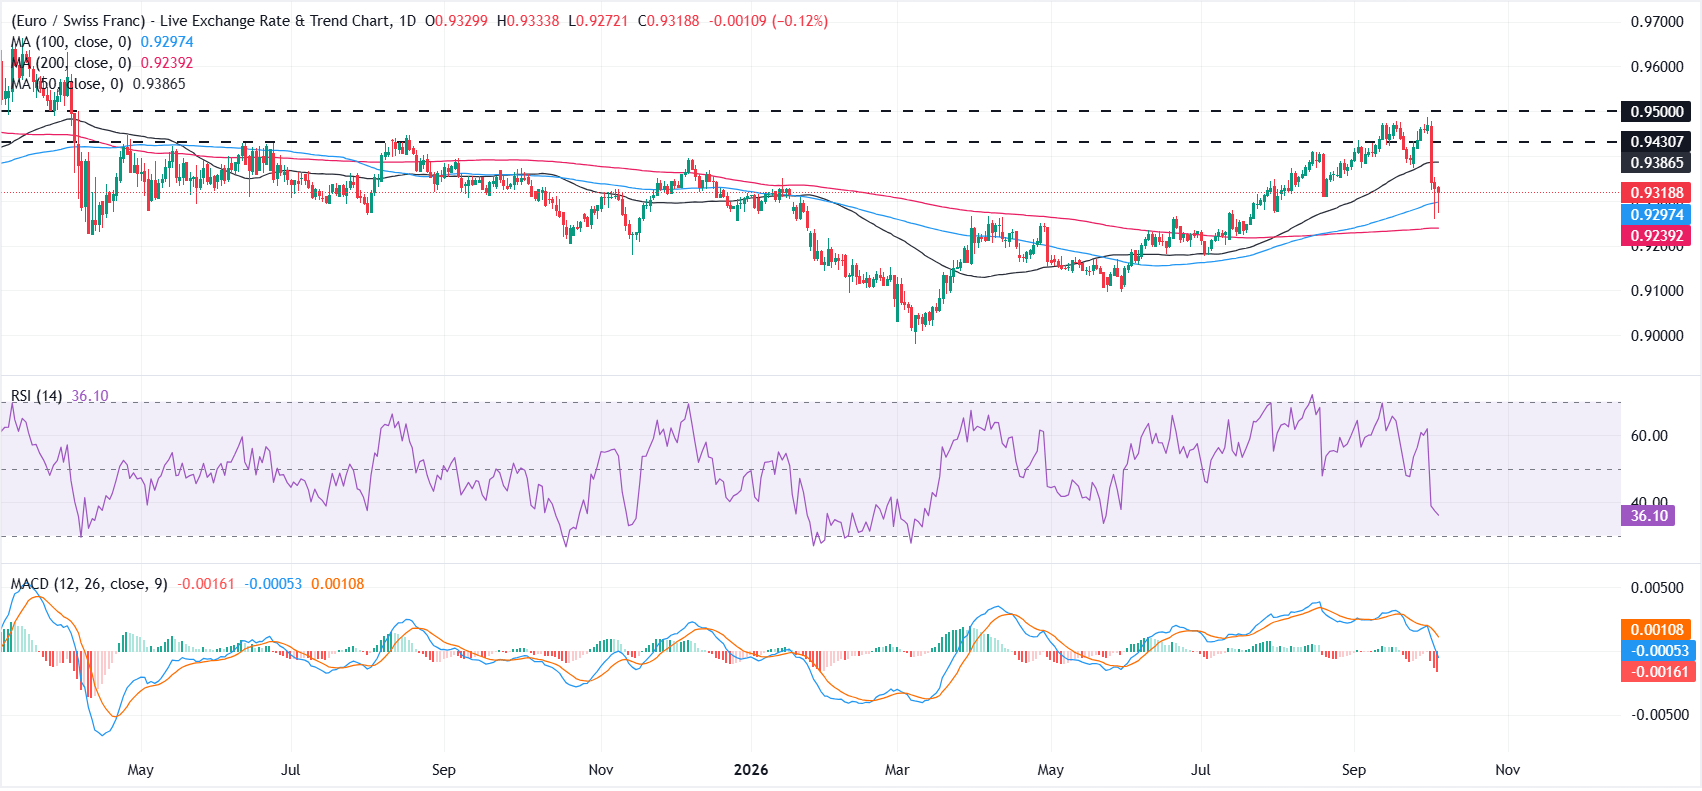
The daily chart shows EUR/CHF under renewed selling pressure after a sharp rejection from the 0.9480 area. The cross has fallen below the 50-day Simple Moving Average (SMA) at 0.9387, weakening the near-term picture. However, it remains above the 100-day SMA at 0.9297 and the 200-day SMA at 0.9239, keeping the broader structure relatively supported.
Momentum indicators lean bearish. The Relative Strength Index (RSI) has dropped to around 36, reflecting growing selling pressure but remaining above oversold territory. The Moving Average Convergence Divergence (MACD) line has crossed below the signal line, while the histogram has moved deeper into negative territory.
On the downside, the 100-day SMA near 0.9297 offers initial support, followed by Monday’s low around 0.9272. A clear break below this area could expose the 200-day SMA at 0.9239. On the topside, the 50-day SMA at 0.9387 acts as immediate resistance, followed by 0.9430. A sustained move above this level could open the door to the 0.9500 psychological mark.
(The technical analysis of this story was written with the help of an AI tool. Know more.)
Euro Price Today
The table below shows the percentage change of Euro (EUR) against listed major currencies today. Euro was the strongest against the New Zealand Dollar.
| USD | EUR | GBP | JPY | CAD | AUD | NZD | CHF | |
|---|---|---|---|---|---|---|---|---|
| USD | 0.45% | 0.23% | 0.11% | 0.02% | -0.30% | 0.50% | 0.34% | |
| EUR | -0.45% | -0.17% | -0.30% | -0.37% | -0.56% | -0.01% | -0.07% | |
| GBP | -0.23% | 0.17% | -0.13% | -0.21% | -0.38% | 0.15% | 0.11% | |
| JPY | -0.11% | 0.30% | 0.13% | -0.10% | -0.32% | 0.29% | 0.23% | |
| CAD | -0.02% | 0.37% | 0.21% | 0.10% | -0.21% | 0.37% | 0.31% | |
| AUD | 0.30% | 0.56% | 0.38% | 0.32% | 0.21% | 0.55% | 0.50% | |
| NZD | -0.50% | 0.01% | -0.15% | -0.29% | -0.37% | -0.55% | -0.06% | |
| CHF | -0.34% | 0.07% | -0.11% | -0.23% | -0.31% | -0.50% | 0.06% |
The heat map shows percentage changes of major currencies against each other. The base currency is picked from the left column, while the quote currency is picked from the top row. For example, if you pick the Euro from the left column and move along the horizontal line to the US Dollar, the percentage change displayed in the box will represent EUR (base)/USD (quote).
Recommended Articles


