


Litecoin Price Forecast: LTC poised for an extended $60-bound breakout
- Litecoin reaffirms its short-term bullish outlook after reclaiming the 200-day EMA as support.
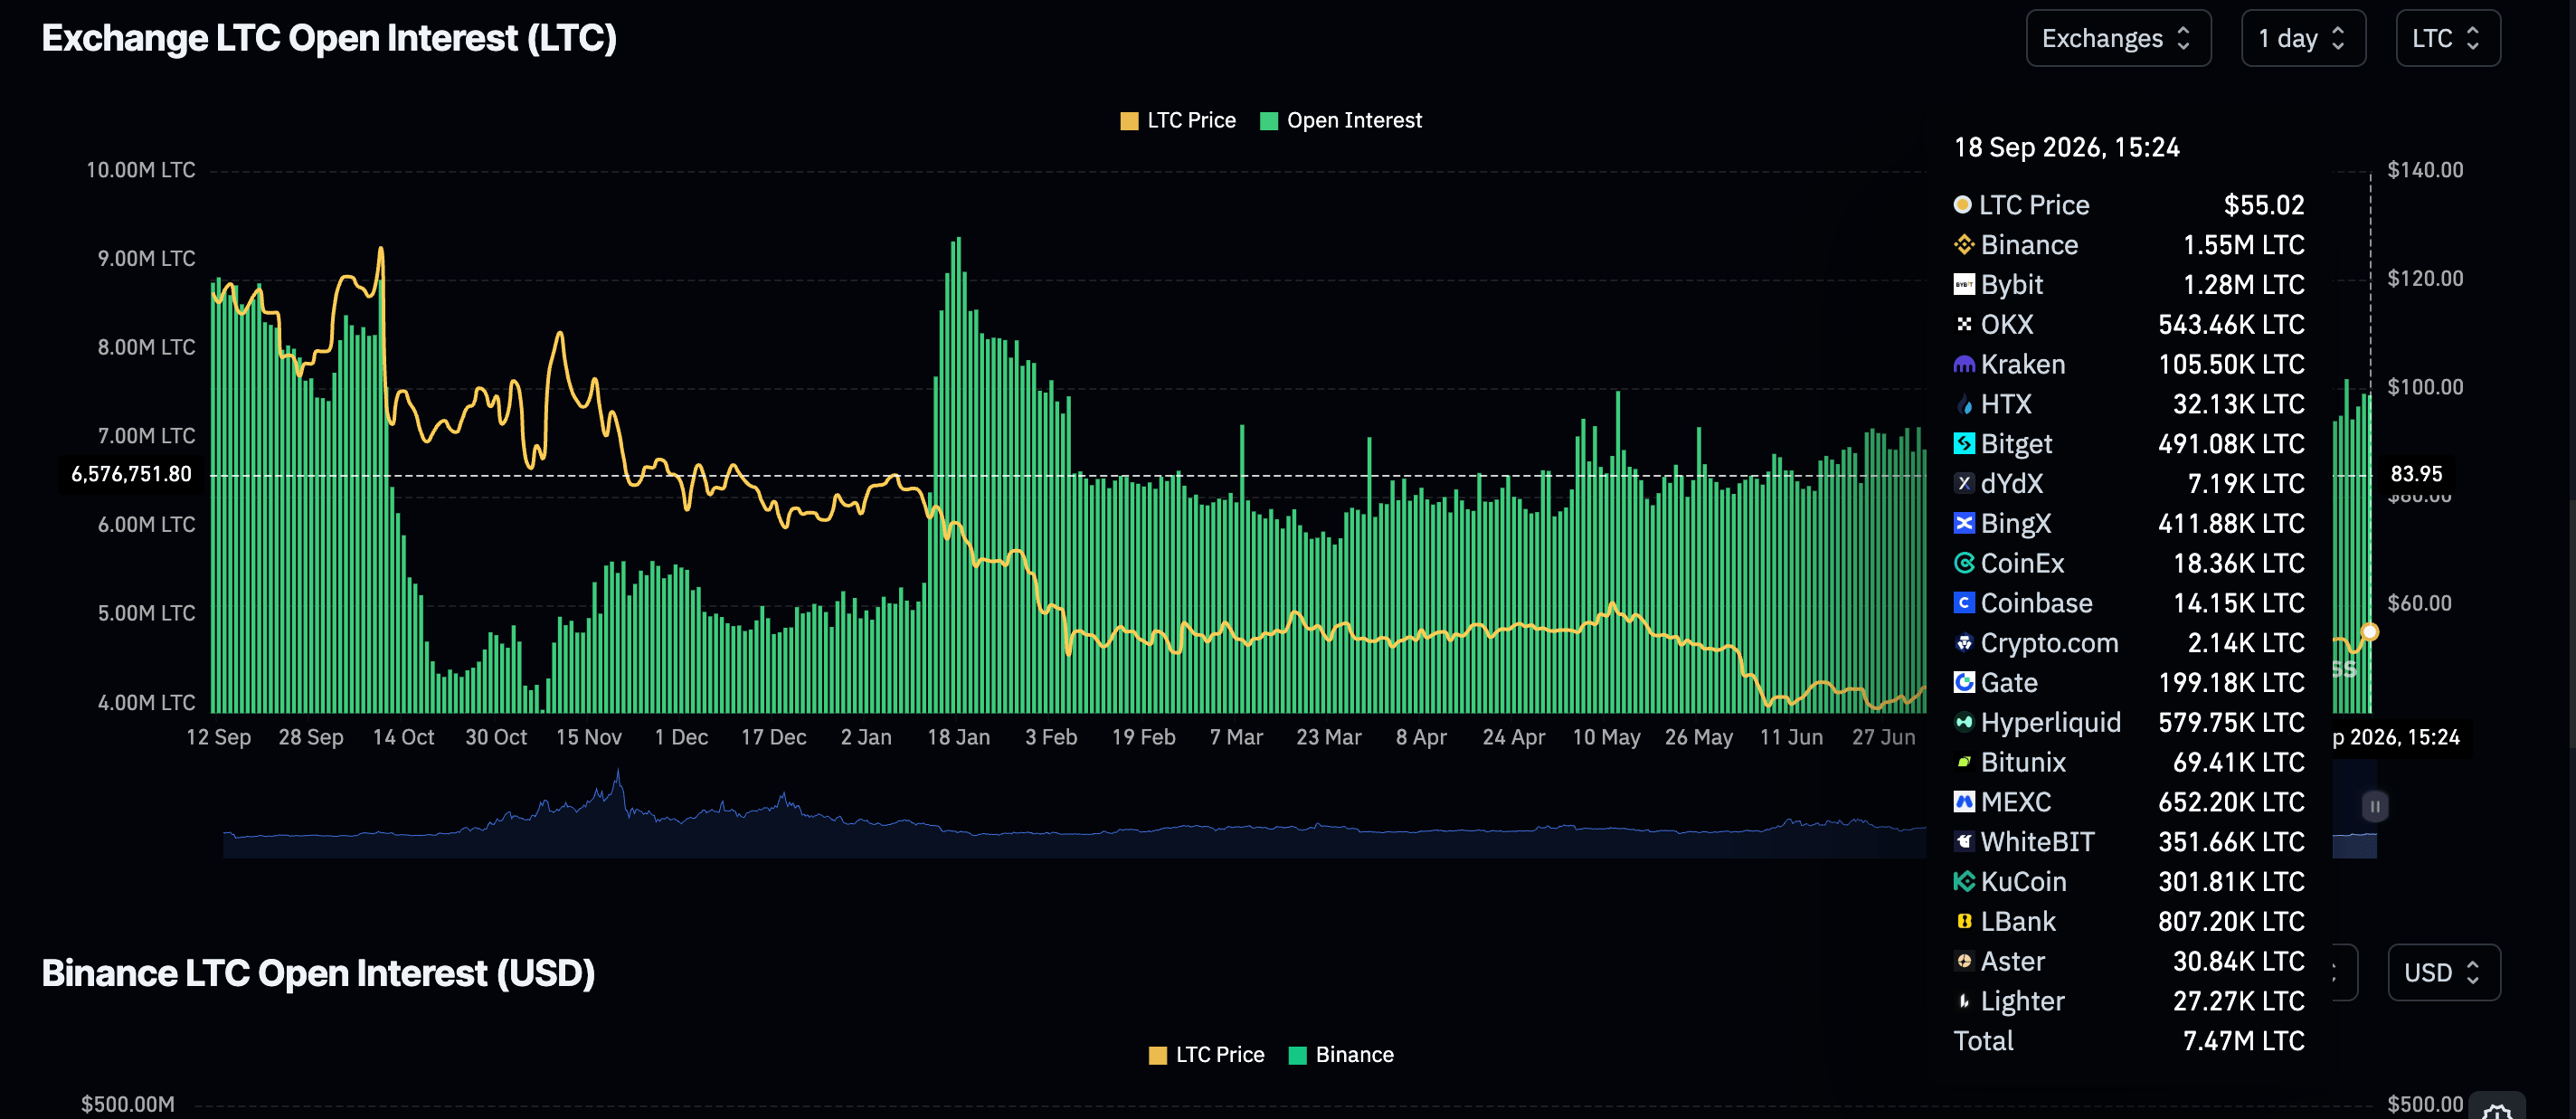
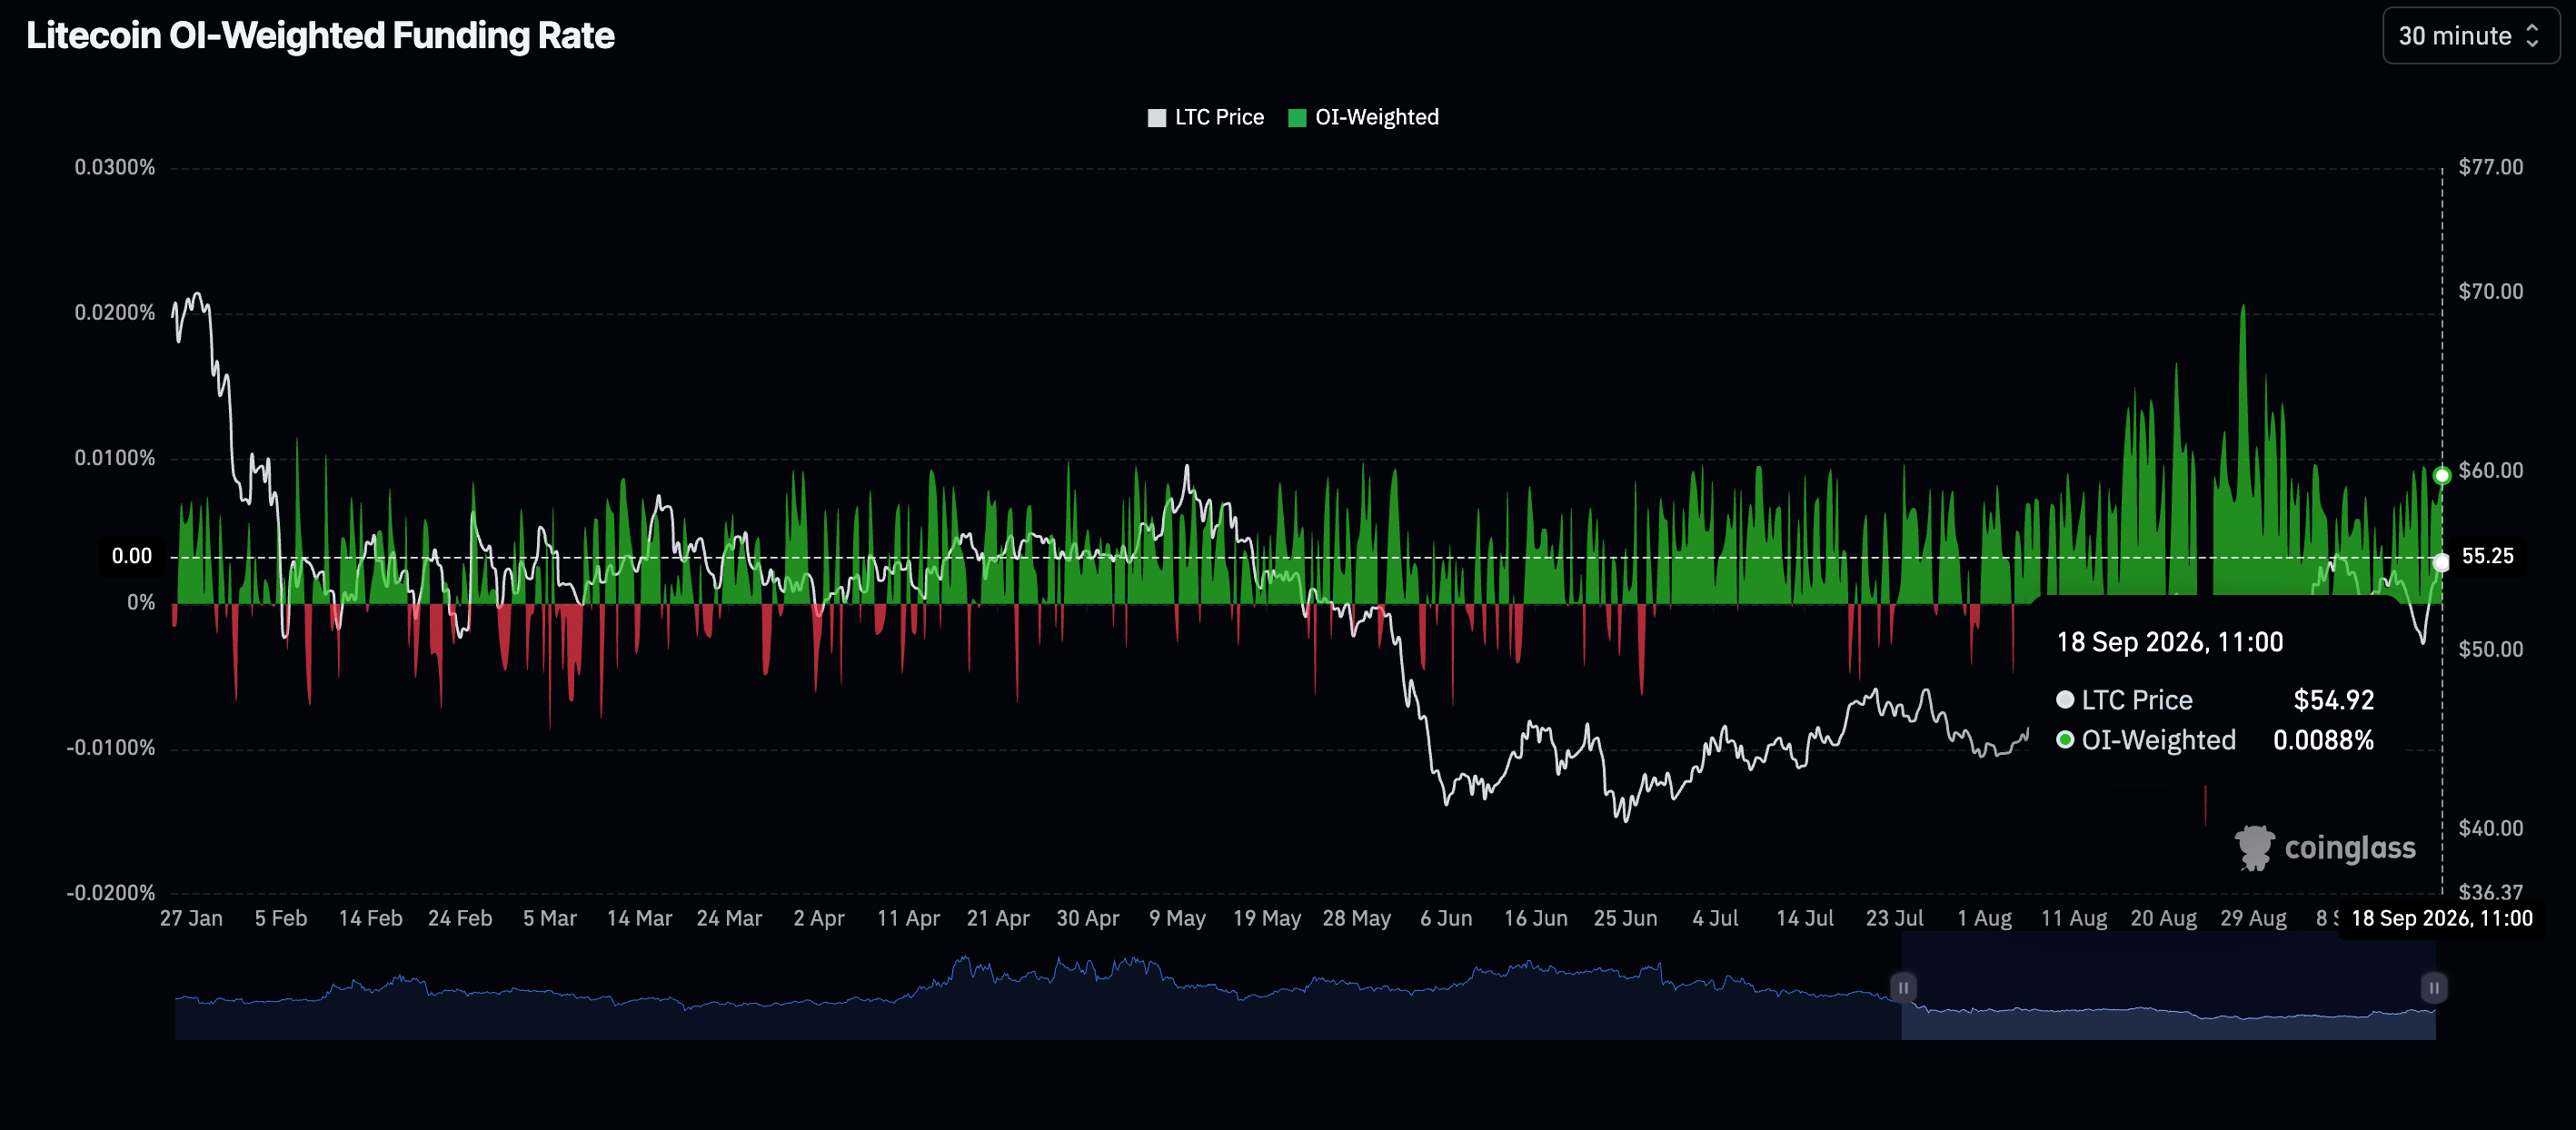
- Retail demand remains elevated, with perpetual futures Open Interest at 7.5 million LTC amid a positive weighted funding rate.
- Litecoin downside remains broadly supported, but short-term breakouts depend on steady momentum indicators.
Litecoin (LTC) extends its gains on Friday, exchanging hands at $55.00. The 28th-largest cryptocurrency, with a market capitalization of $4.3 billion, has notched a third straight session of recovery from the critical $50.00 support zone.
Continued momentum here could pave the way for a decisive breakout above $60.00, reinforced by a strong cluster of moving averages.
Retail demand props Litecoin gains
Litecoin derivatives market remains steady, attracting 7.5 million LTC in perpetual futures Open Interest (OI) on Friday, up from 7.4 million LTC the day before. More broadly, the metric has steadily recovered in recent months, underscoring growing appetite for risk assets.
Moreover, Litecoin OI-weighted funding rate remains positive, indicating bulls are willing to pay a premium in fees to keep their long positions open, anticipating a potential move above $60.00.
Technical analysis: Litecoin bulls tighten grip as price ticks up
Litecoin trades at $55.00, maintaining a constructive bullish bias as price stays above key Exponential Moving Averages (EMAs). The 50-day EMA at $50.18, the 100-day EMA at $49.49 and the 200-day EMA at $53.52 all sit below spot, suggesting an underlying supportive trend structure.
Still, the Moving Average Convergence Divergence (MACD) is turning negative and hinting at waning momentum. The Relative Strength Index (RSI) near 63 stays in positive territory without reaching overbought conditions, reinforcing the idea of a still upwardly biased but moderating advance.
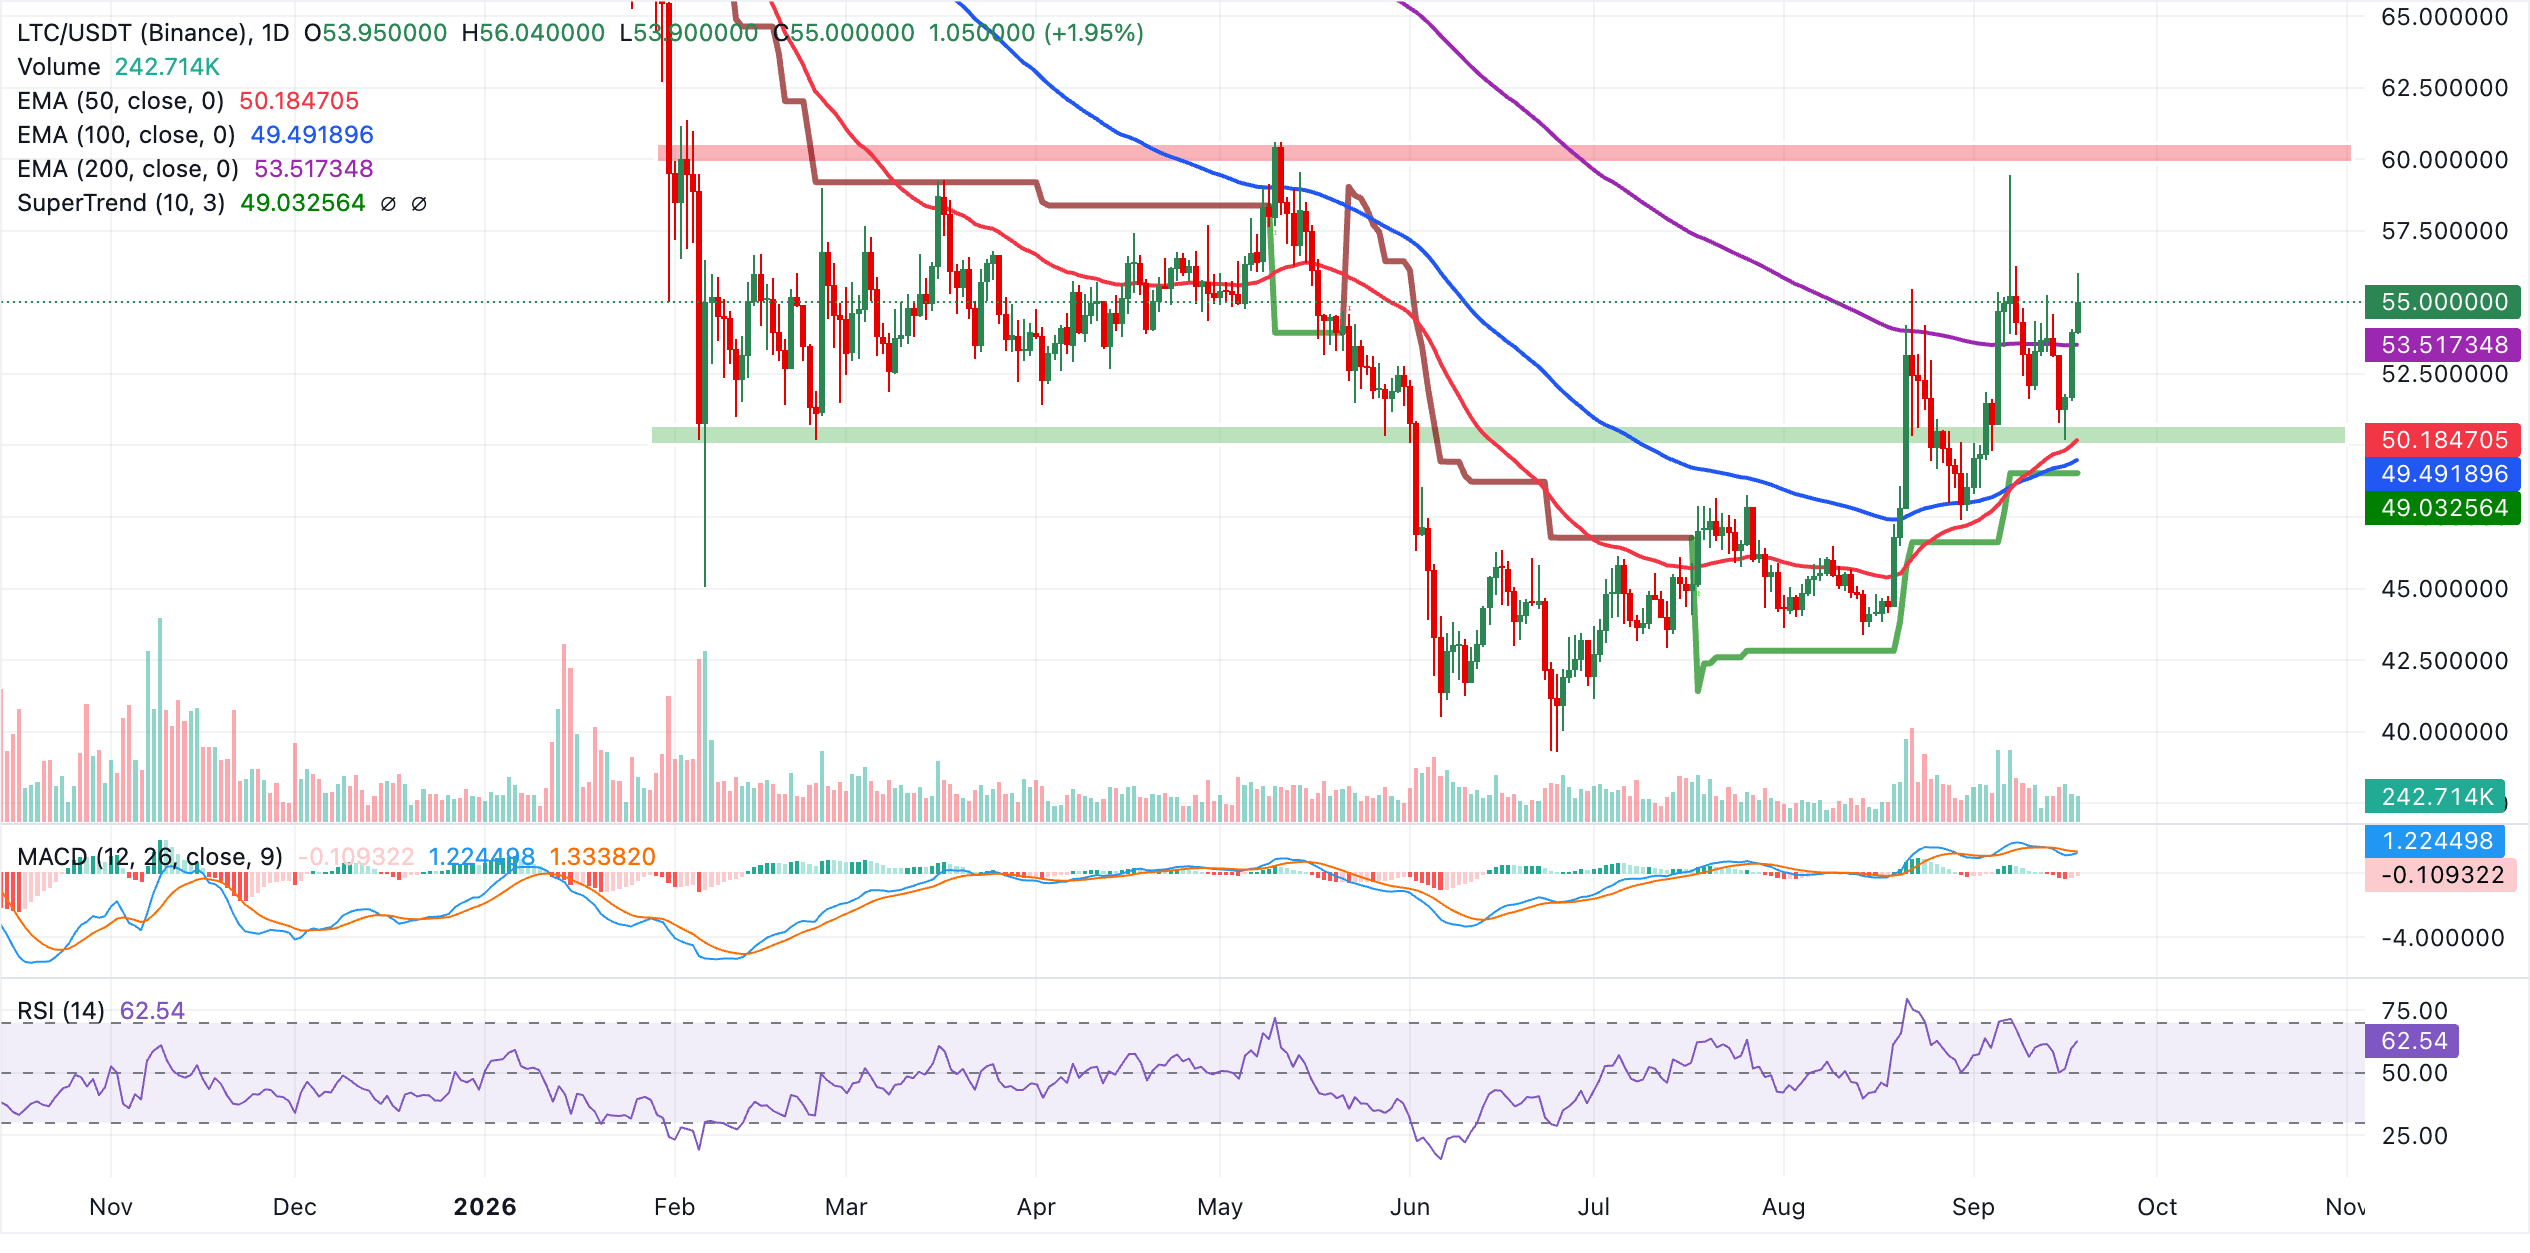
On the downside, initial demand is seen at the 200-day EMA near $53.52, ahead of the 50-day EMA at $50.18 and the 100-day EMA at $49.49, which form a broader support band on deeper pullbacks. On the topside, the SuperTrend line at $49.03 now lies well below the current price and does not cap the market in the near term, leaving LTC focused on whether it can hold above the clustered EMAs to preserve the current bullish tone for a breakout beyond $60.00.
(The technical analysis of this story was written with the help of an AI tool. Know more.)
Open Interest, funding rate FAQs
Higher Open Interest is associated with higher liquidity and new capital inflow to the market. This is considered the equivalent of increase in efficiency and the ongoing trend continues. When Open Interest decreases, it is considered a sign of liquidation in the market, investors are leaving and the overall demand for an asset is on a decline, fueling a bearish sentiment among investors.
Funding fees bridge the difference between spot prices and prices of futures contracts of an asset by increasing liquidation risks faced by traders. A consistently high and positive funding rate implies there is a bullish sentiment among market participants and there is an expectation of a price hike. A consistently negative funding rate for an asset implies a bearish sentiment, indicating that traders expect the cryptocurrency’s price to fall and a bearish trend reversal is likely to occur.
Recommended Articles


