


Bitcoin and Gold Outlook: BTC and XAU tick down as Middle East tensions grow
- Bitcoin declines for the second straight day and tests $78,000 support as headwinds intensify.
- Gold slips below $4,400 amid weakening momentum indicators while key moving averages provide support.
- Geopolitical tensions in the Middle East remain high, triggering a steady increase in Oil prices.
Bitcoin (BTC) is correcting lower for the second consecutive day, trading near $78,000 on Tuesday. The largest cryptocurrency by market capitalization also holds above major moving averages, reinforcing a broader bullish outlook despite the pullback from last week's peak near $82,300.
Meanwhile, Gold (XAU/USD) is similarly edging lower below $4,400, down three consecutive days. The metal sits above key moving averages, which are helping offset the headwinds, especially as momentum indicators deteriorate.
Oil prices rise amid growing Middle East tensions
Iran-backed Houthi rebels have intensified their attacks across multiple Saudi cities, leaving dozens wounded and disrupting operations at key energy facilities, a clear sign of escalating conflict in the Middle East and faltering diplomatic efforts.
The energy ministry confirmed that multiple facilities sustained damage, resulting in fires and temporary operational disruptions.
Saudi Arabia has pledged a decisive response to coordinated attacks targeting the southern cities of Abha, Khamis, Mushait, Jazan, and Najran, according to a report by The Independent.
The Houthis, who control Yemen’s most populous regions and much of the north, have maintained a campaign of attacks on Saudi Arabia since imposing a naval blockade against Riyadh in July, with strikes increasingly targeting Saudi vessels in the Red Sea.
Meanwhile, Iran escalated warnings against the United States (US), threatening “economic warfare” and claiming to have launched an advanced missile at American warships.
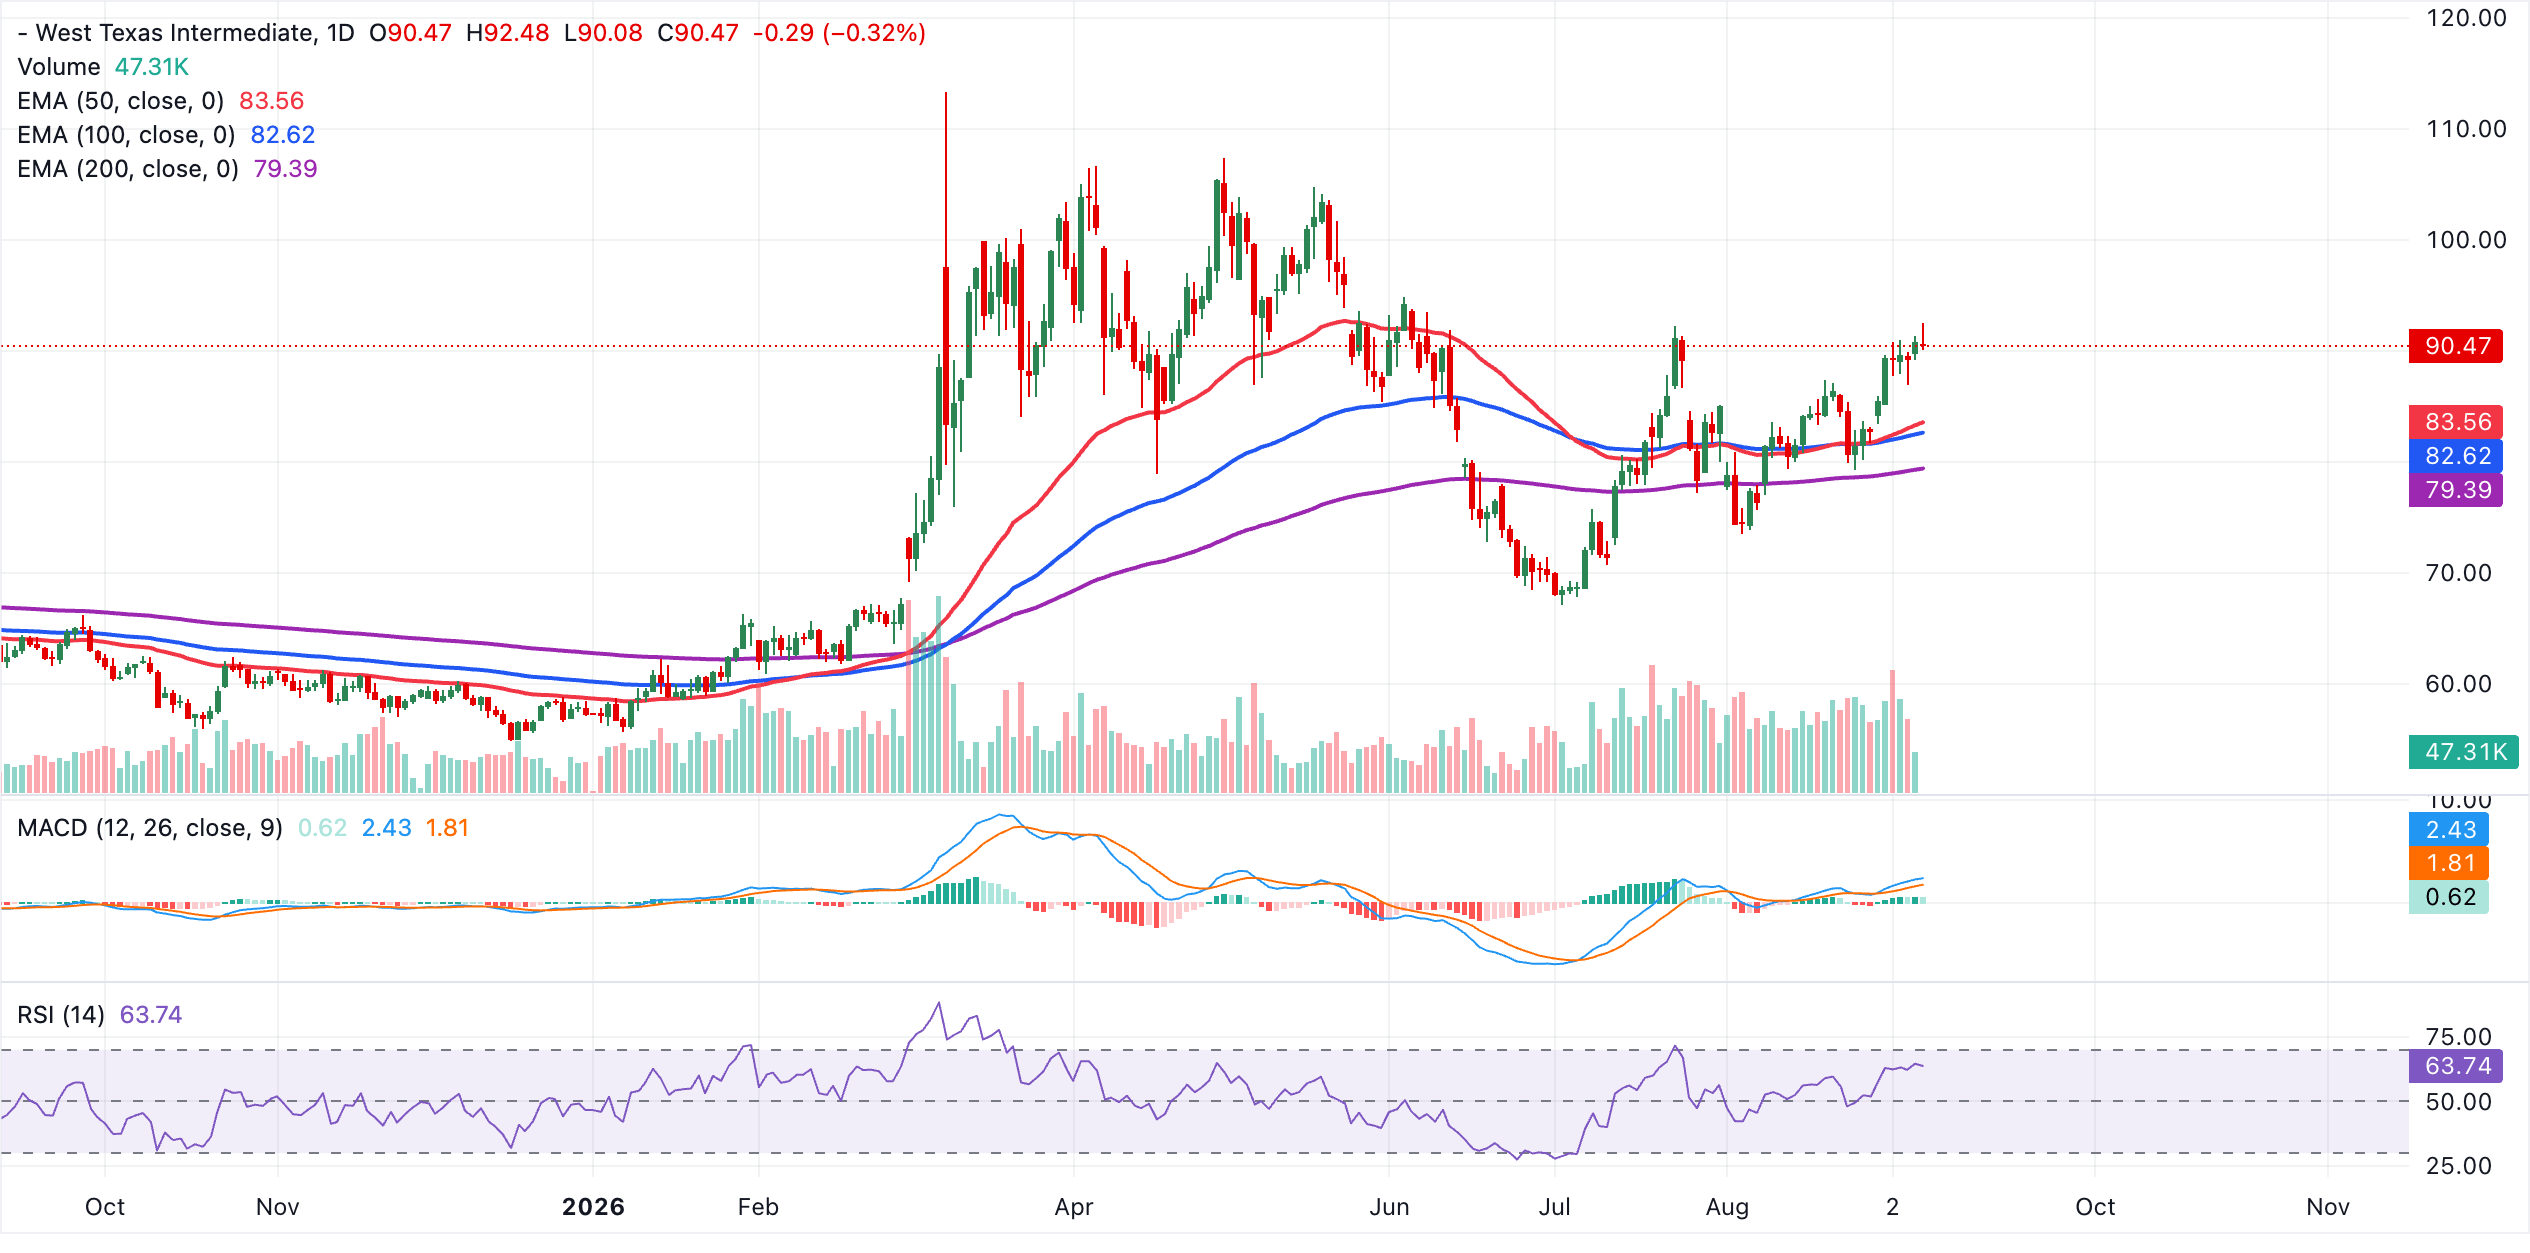
West Texas Intermediate (WTI) Crude Oil prices are holding steady above $90.00, up more than 6% since September 1 and 23% since the August low of $73.58. Disruptions to shipping through the Strait of Hormuz and Houthi attacks in the Red Sea and on Saudi Arabia's energy infrastructure are the primary drivers of rising Oil prices.
Market participants are pricing in a higher probability that the Federal Reserve (Fed) will adopt a stricter monetary policy by raising interest rates. The release of the US Consumer Price Index (CPI) report on Friday could offer more insight into how the central bank could swing.
Technical analysis: Bitcoin risks extending losses
Bitcoin is correcting near $78,000 following a recent rejection from highs near $81,500. Despite the pullback, the Crypto King holds a bullish near-term bias as the spot price remains well above the 50-day, 100-day and 200-day Exponential Moving Averages (EMAs), which cluster between roughly $70,400 and $72,700 and suggest a firmly supported underlying trend.
The Relative Strength Index (RSI) has eased back toward 59, indicating the market has cooled from overbought extremes without yet undermining the broader uptrend, while the negative Moving Average Convergence Divergence (MACD) reading hints at corrective pressure developing within an otherwise constructive structure.
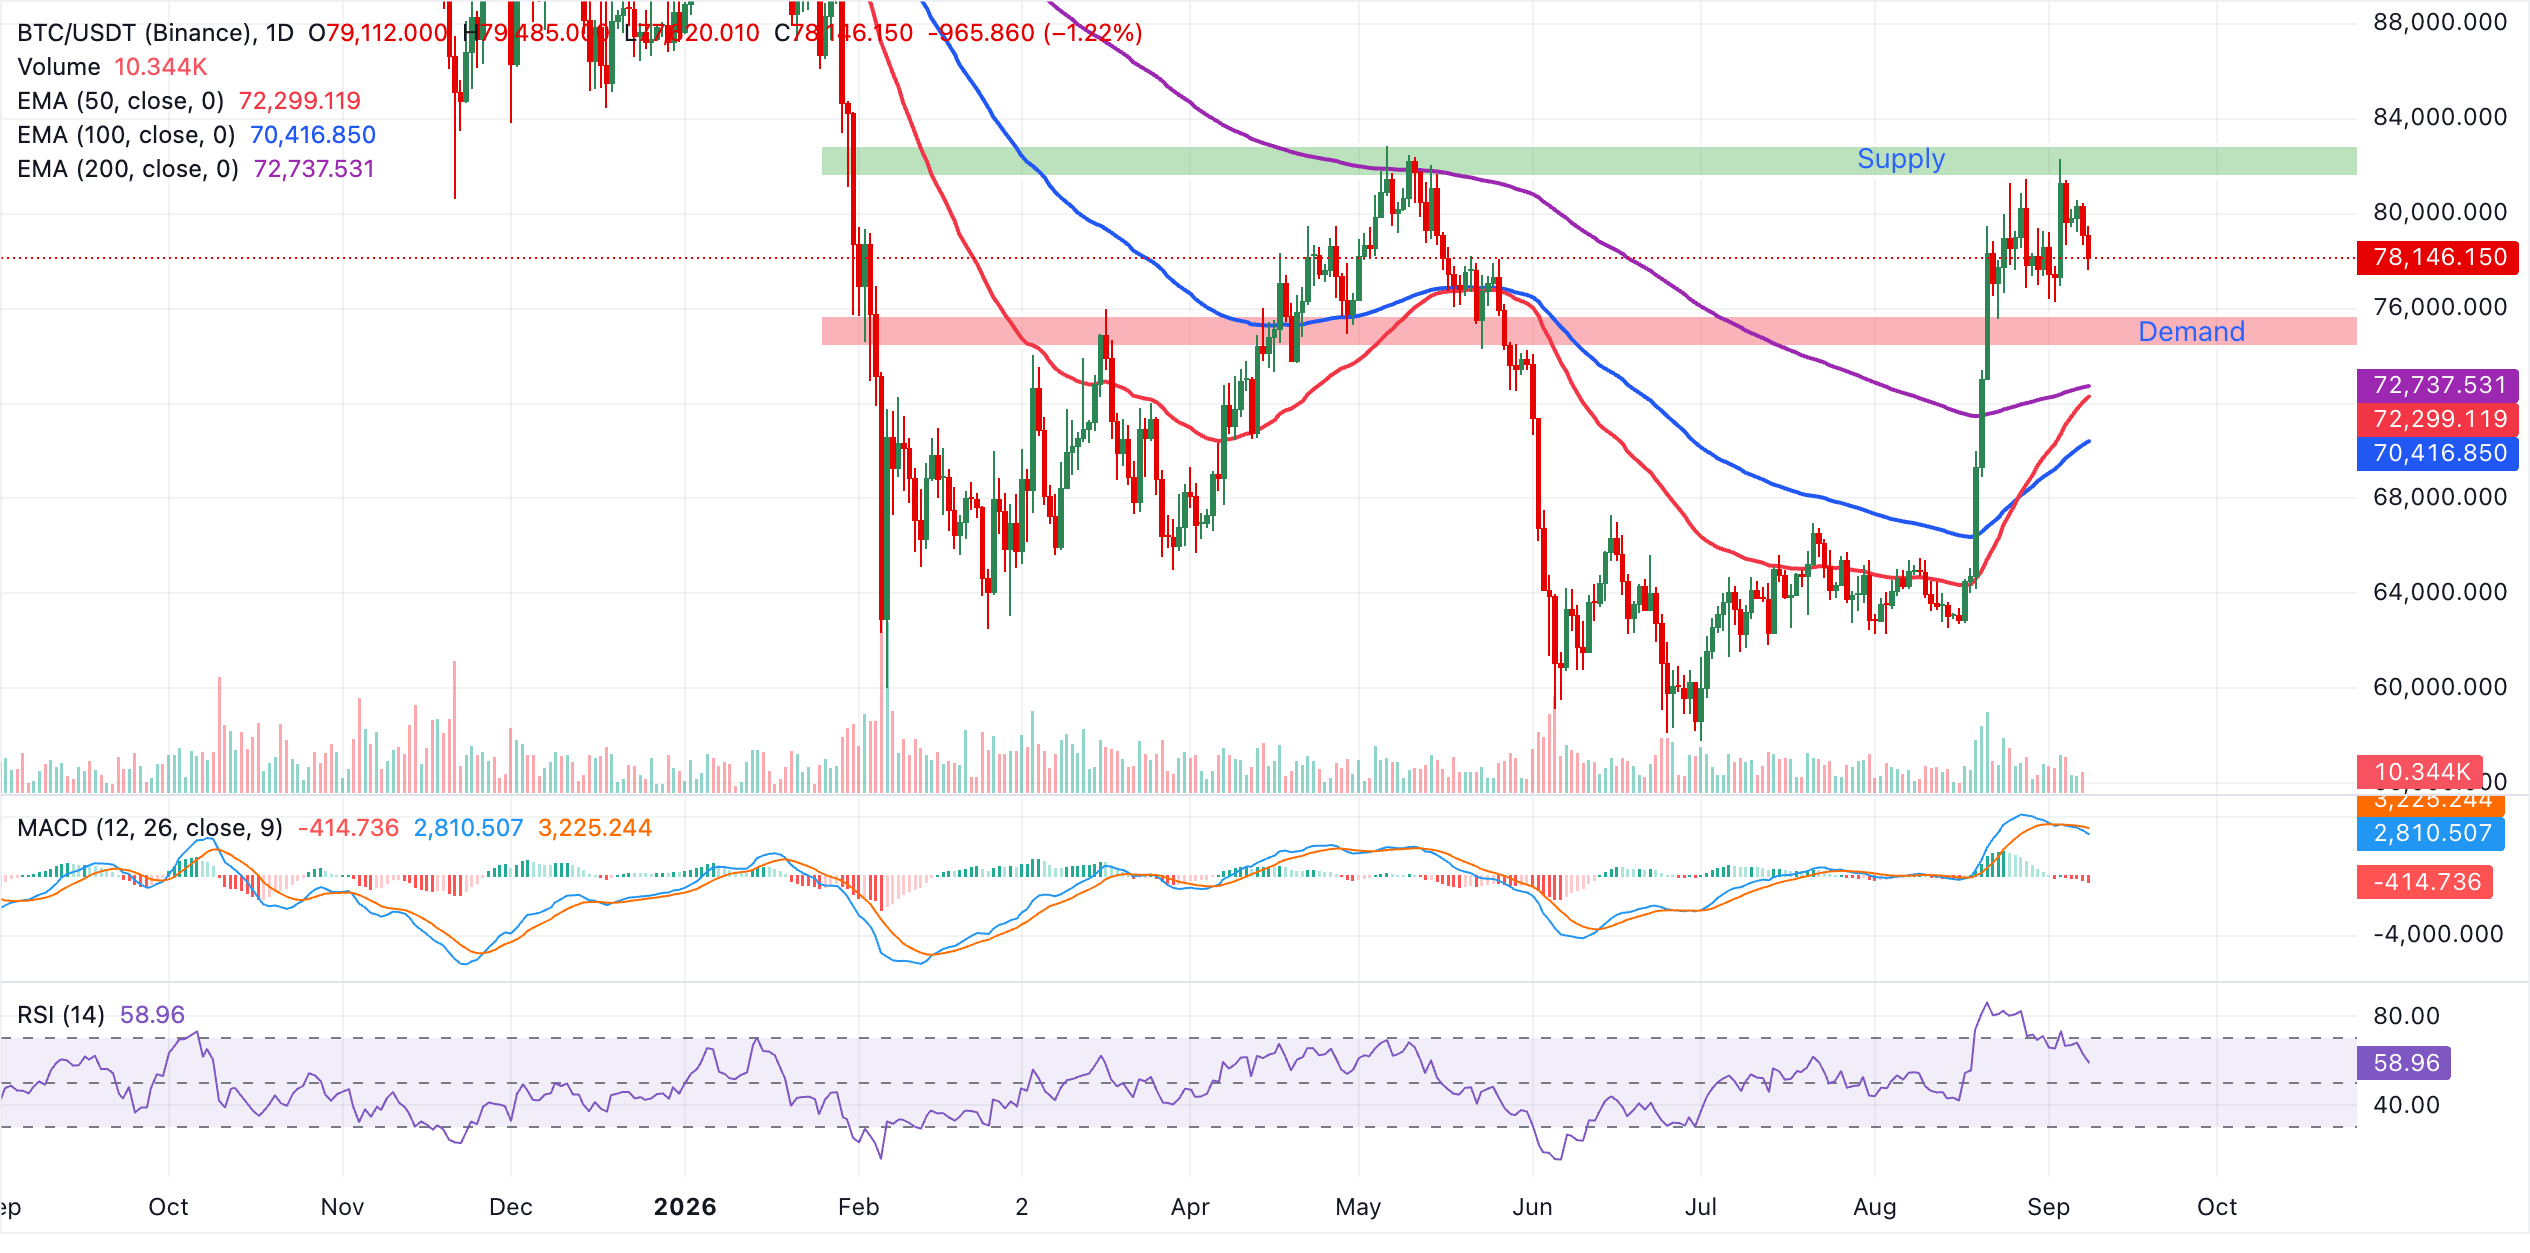
Immediate support emerges at the rising 200-day EMA near $72,738, reinforced by the 50-day EMA around $72,300 and deeper demand at the 100-day EMA close to $70,417 if sellers extend a pullback. As long as BTC holds above this moving average band, dips are likely to be treated as corrective within the dominant uptrend, with buyers expected to defend these levels to keep the broader bullish structure intact.
Gold technical analysis: XAU faces deeper correction as momentum fades
Gold edges below $4,400, with persistent headwinds limiting upside potential and heightening the risk of a more pronounced correction. Still, the metal holds above the 50-day, 100-day, and 200-day EMAs clustered between roughly $4,320 and $4,370, suggesting a still constructive near-term bias after the recent pullback from record highs.
The long-standing downward resistance trendline, now represented by the break area around $4,523, remains the key cap above the spot price. At the same time, the RSI has eased back toward the 50 region, hinting at consolidative rather than impulsive downside, while the MACD sits below its recent peak with a negative histogram, suggesting waning bullish momentum but not a completed trend reversal as long as price stays over the major EMAs.
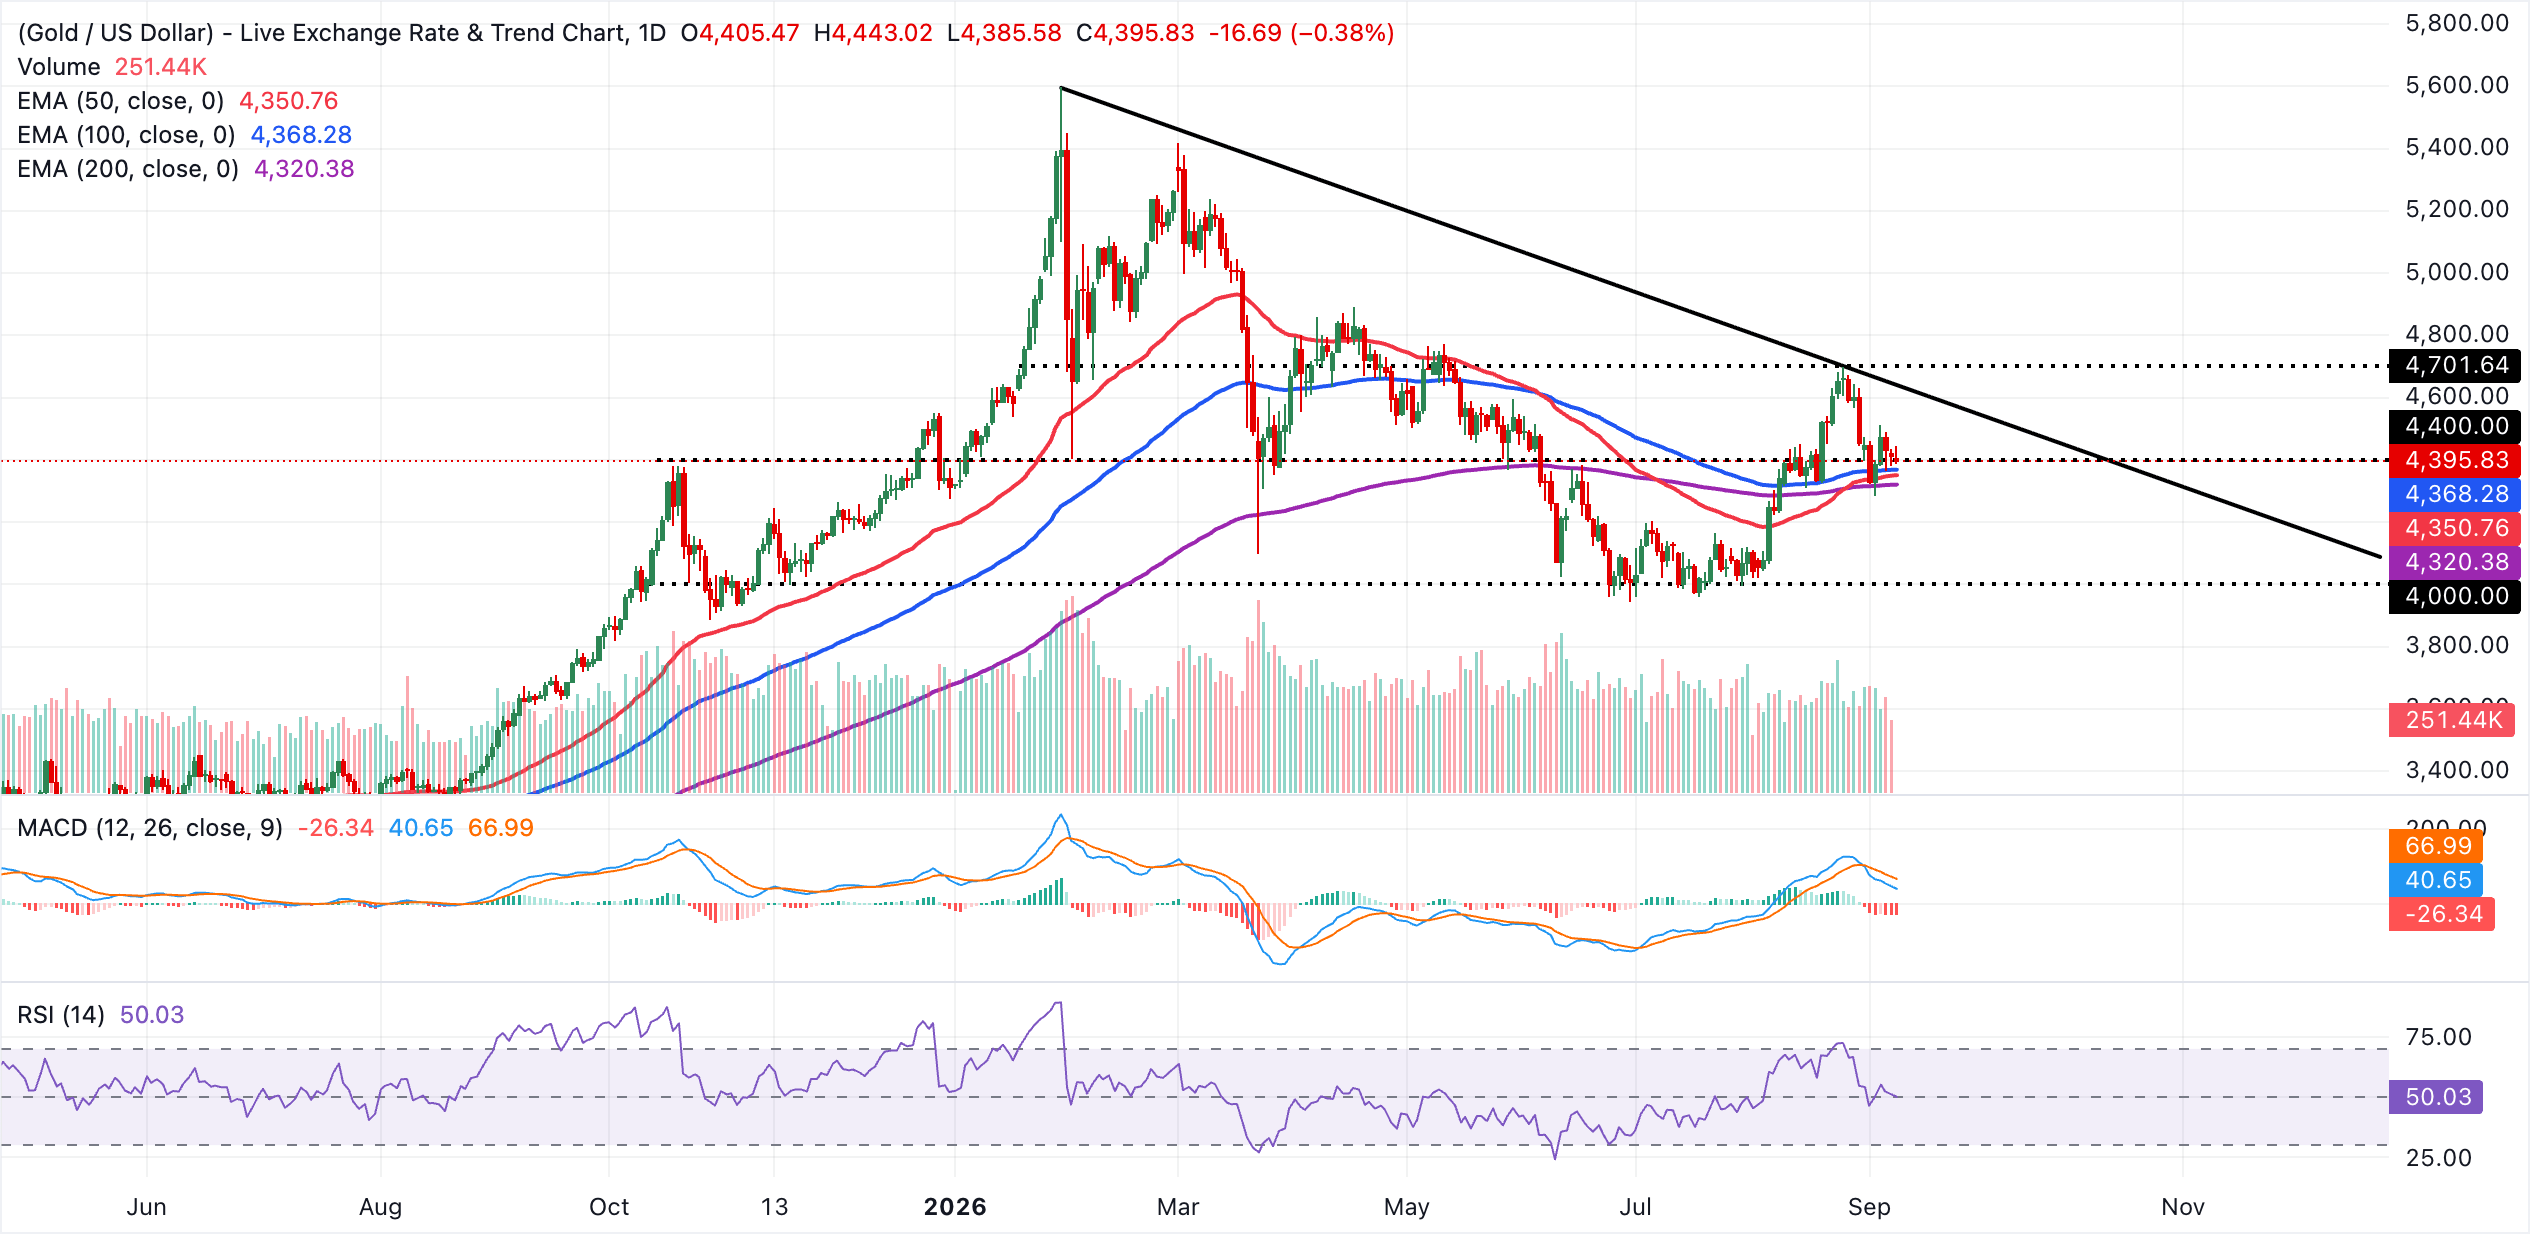
On the downside, immediate support is seen at the 100-day EMA near $4,368, followed by the 50-day EMA around $4,351 and then the 200-day EMA near $4,320, where dip-buying interest could re-emerge if the correction deepens. On the topside, primary resistance sits at the former trendline break zone around $4,523. A daily close above this barrier would reopen the path toward the recent peak and reinforce the broader bullish structure, whereas repeated failure below it would keep XAU confined to a consolidation band above its EMA floor.
(The technical analysis of this story was written with the help of an AI tool. Know more.)
Bitcoin, altcoins, stablecoins FAQs
Bitcoin is the largest cryptocurrency by market capitalization, a virtual currency designed to serve as money. This form of payment cannot be controlled by any one person, group, or entity, which eliminates the need for third-party participation during financial transactions.
Altcoins are any cryptocurrency apart from Bitcoin, but some also regard Ethereum as a non-altcoin because it is from these two cryptocurrencies that forking happens. If this is true, then Litecoin is the first altcoin, forked from the Bitcoin protocol and, therefore, an “improved” version of it.
Stablecoins are cryptocurrencies designed to have a stable price, with their value backed by a reserve of the asset it represents. To achieve this, the value of any one stablecoin is pegged to a commodity or financial instrument, such as the US Dollar (USD), with its supply regulated by an algorithm or demand. The main goal of stablecoins is to provide an on/off-ramp for investors willing to trade and invest in cryptocurrencies. Stablecoins also allow investors to store value since cryptocurrencies, in general, are subject to volatility.
Bitcoin dominance is the ratio of Bitcoin's market capitalization to the total market capitalization of all cryptocurrencies combined. It provides a clear picture of Bitcoin’s interest among investors. A high BTC dominance typically happens before and during a bull run, in which investors resort to investing in relatively stable and high market capitalization cryptocurrency like Bitcoin. A drop in BTC dominance usually means that investors are moving their capital and/or profits to altcoins in a quest for higher returns, which usually triggers an explosion of altcoin rallies.
Recommended Articles


