


Crypto Overview: Bitcoin faces sell wall at $82,850 amid $1 billion crypto ETF inflows – Jupiter, Zcash rally
- Bitcoin hovers below $80,000 on Monday, extending a near-term pullback amid intense overhead resistance.
- Crypto ETFs recorded nearly $1.25 billion in inflows last week, reflecting firm institutional demand.
- Jupiter and Zcash extend gains over the last 24 hours, emerging as top performers.
Bitcoin (BTC) price tumbles below $80,000 on Monday amid improved odds of a rate hike with the robust US employment data. Institutional demand holds firm with crypto-focused Exchange Traded Funds (ETFs) recording nearly $1.25 billion in inflows last week. Jupiter (JUP) and Zcash (ZEC) extend gains over the last 24 hours, leading the broader crypto market rally.
Crypto ETFs record third consecutive week of over $1 billion in inflows
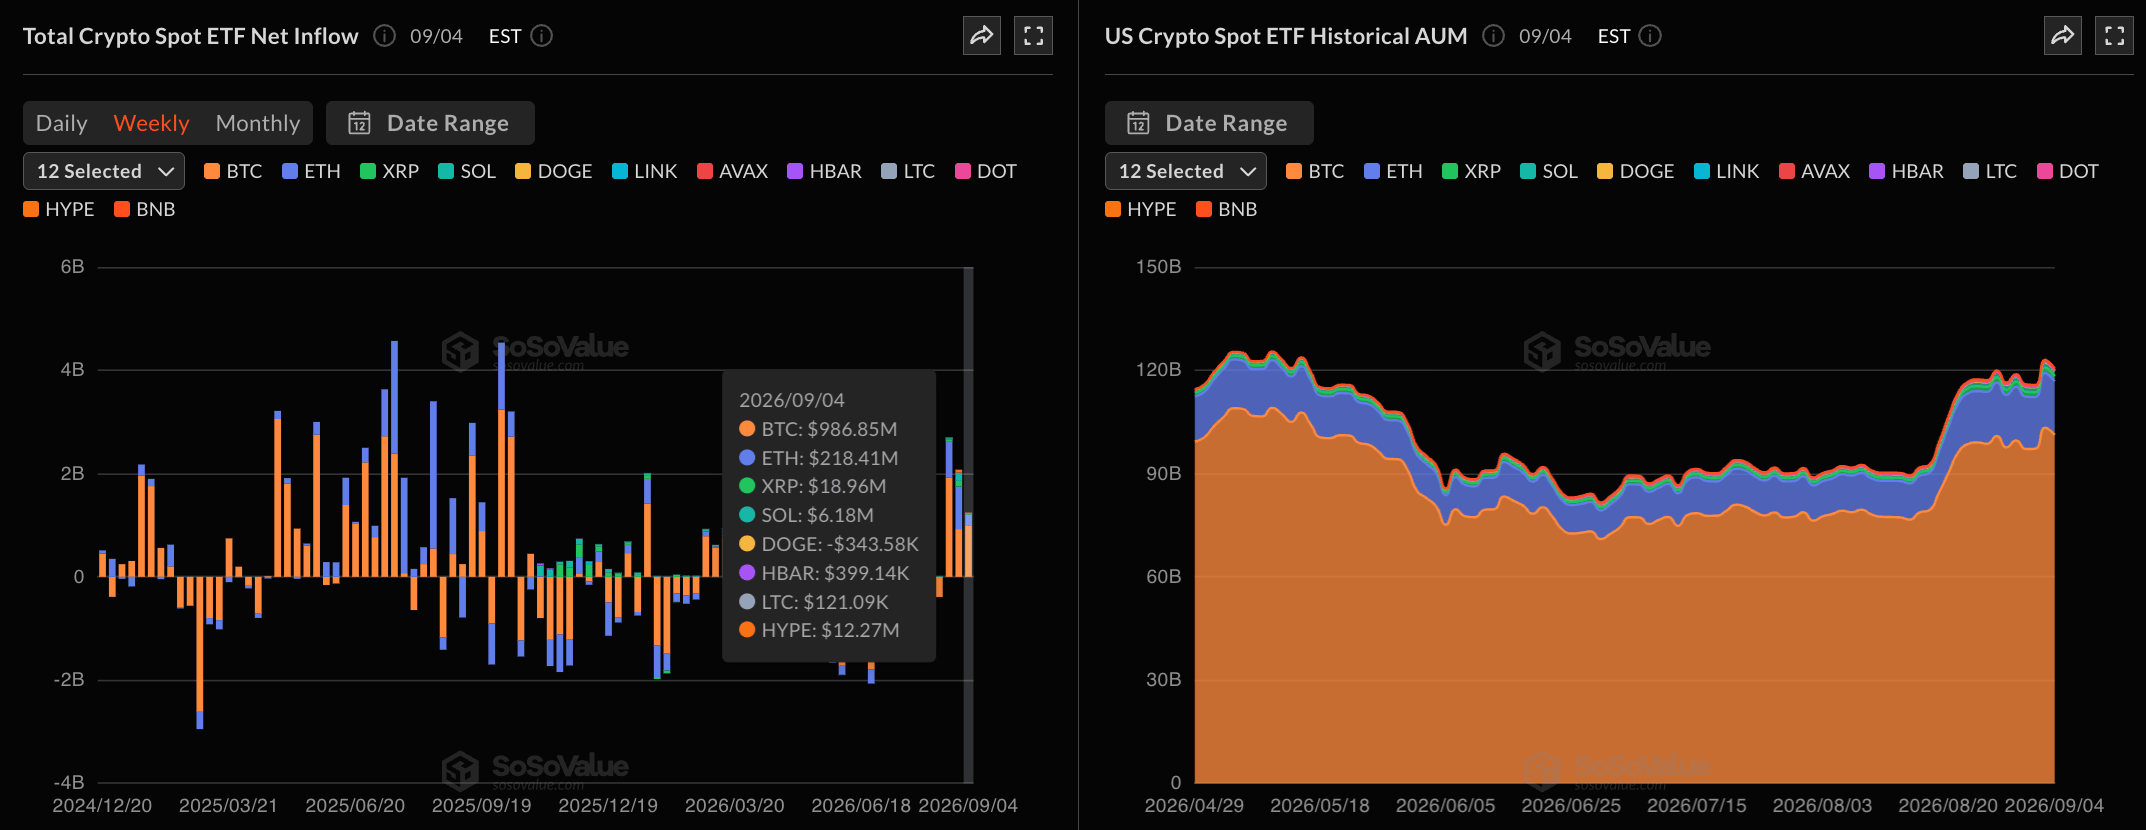
CoinGlass data shows that Bitcoin and Ethereum (ETH) ETFs recorded $986 million and $218 million in inflows last week, while the rest of the altcoin funds saw positive inflows, except for Dogecoin (DOGE), which saw $343,580 in outflows. Last week’s total inflows stood at $1.24 billion, recording the third consecutive weekly inflow of over $1 billion, indicating firm demand among large institutional investors.
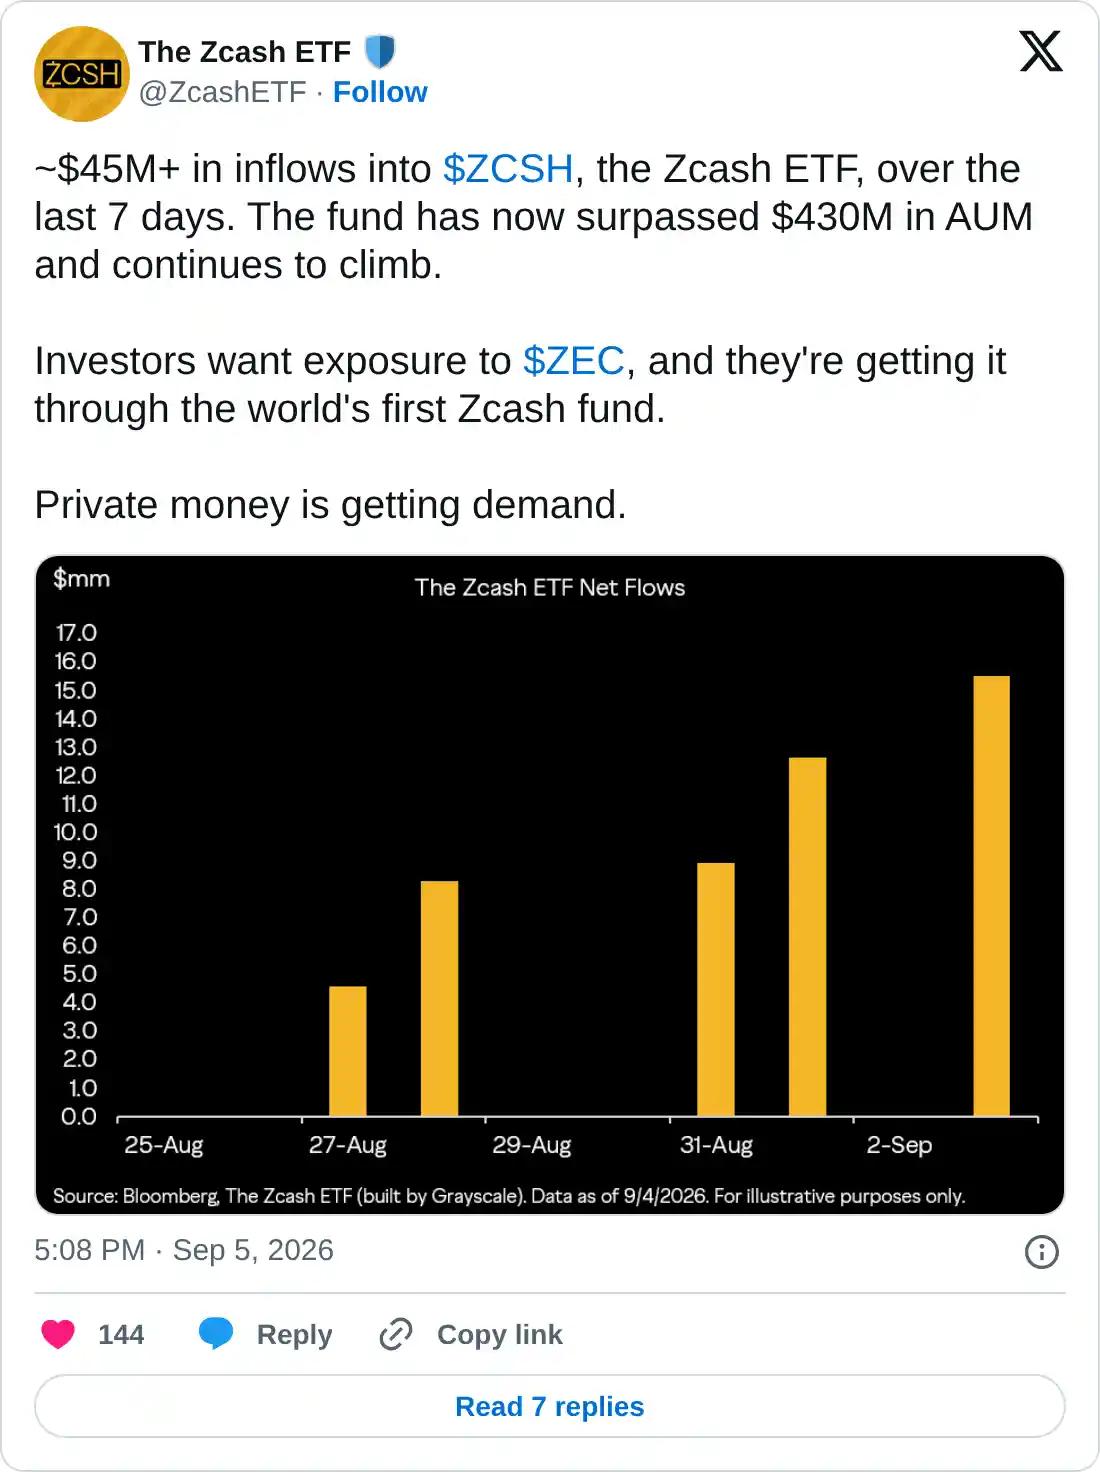
In addition, Grayscale’s ZEC-focused trust-turned-ETF (ZCSH) recorded over $45 million in inflows over the last seven trading sessions, surpassing $430 million in Assets Under Management (AUM). Strong inflows into ZCSH reflect institutional demand diversifying toward private money.
Bitcoin faces sell wall above $80,000
Bitcoin trades around $79,939, maintaining a broadly bullish bias. The King Crypto holds well above the 50-day, 100-day, and 200-day Exponential Moving Averages (EMAs), clustered between $70,000 and $73,000, forming a firm support zone.
From a technical perspective, the May 6 high at $82,850 serves as the immediate resistance zone. A confirmed breakout above this level could target the 78.6% Fibonacci retracement level at $89,337, measured from $97,924 to $57,800.
The Relative Strength Index (RSI) is hovering near 66 on the daily chart, suggesting positive yet cooling momentum, while the Moving Average Convergence Divergence (MACD) is slipping below its signal line, hinting at waning upside pressure in the short term.
On the downside, immediate support is seen at the 50% retracement near $77,862, followed by the 200-day EMA just above $72,768 and the 50-day and 100-day EMAs near $72,092 and $70,276, respectively, reinforcing a broader demand zone.
Jupiter and Zcash extend gains
Jupiter trades around $0.2673, sustaining its 25% gains from the previous day's rally. The DeFi token maintains a bullish near-term bias as the price holds well above the 200-day EMA around $0.2114, with the 50-day EMA at $0.2076 and the 100-day EMA near $0.2018 forming a broader demand zone.
The RSI near 67 on the daily chart points to strong but cooling upside momentum, and the MACD is sloping upward above the signal line, suggesting that buyers still have the upper hand
Looking up, a confirmed breakout above the May 10 high at $0.2766 could extend the JUP rally toward the November 10 high at $0.3722.
An extended correction in JUP could find support at the 200-day EMA at $0.2114, followed by the 50-day EMA at $0.2076 and the 100-day EMA near $0.2018.
Zcash edges lower by 3% at press time on Monday, after four consecutive days of rally, totaling to 46% gains last week. The privacy coin holds well above the 50-day, 100-day and 200-day EMAs clustered between $505 and $710, advancing into the price discovery mode.
The 20% gains made the previous day confirmed a breakout above the 127.2% Fibonacci extension level, measured from $368 to $888, at $1,128. This opens the path toward the 161.8% Fibonacci extension level at $1,529 as the next bullish target.
Momentum remains overheated, with the RSI hovering in overbought territory near 81 and the MACD maintaining positive readings, suggesting persistent but potentially stretched buying pressure in the near term.
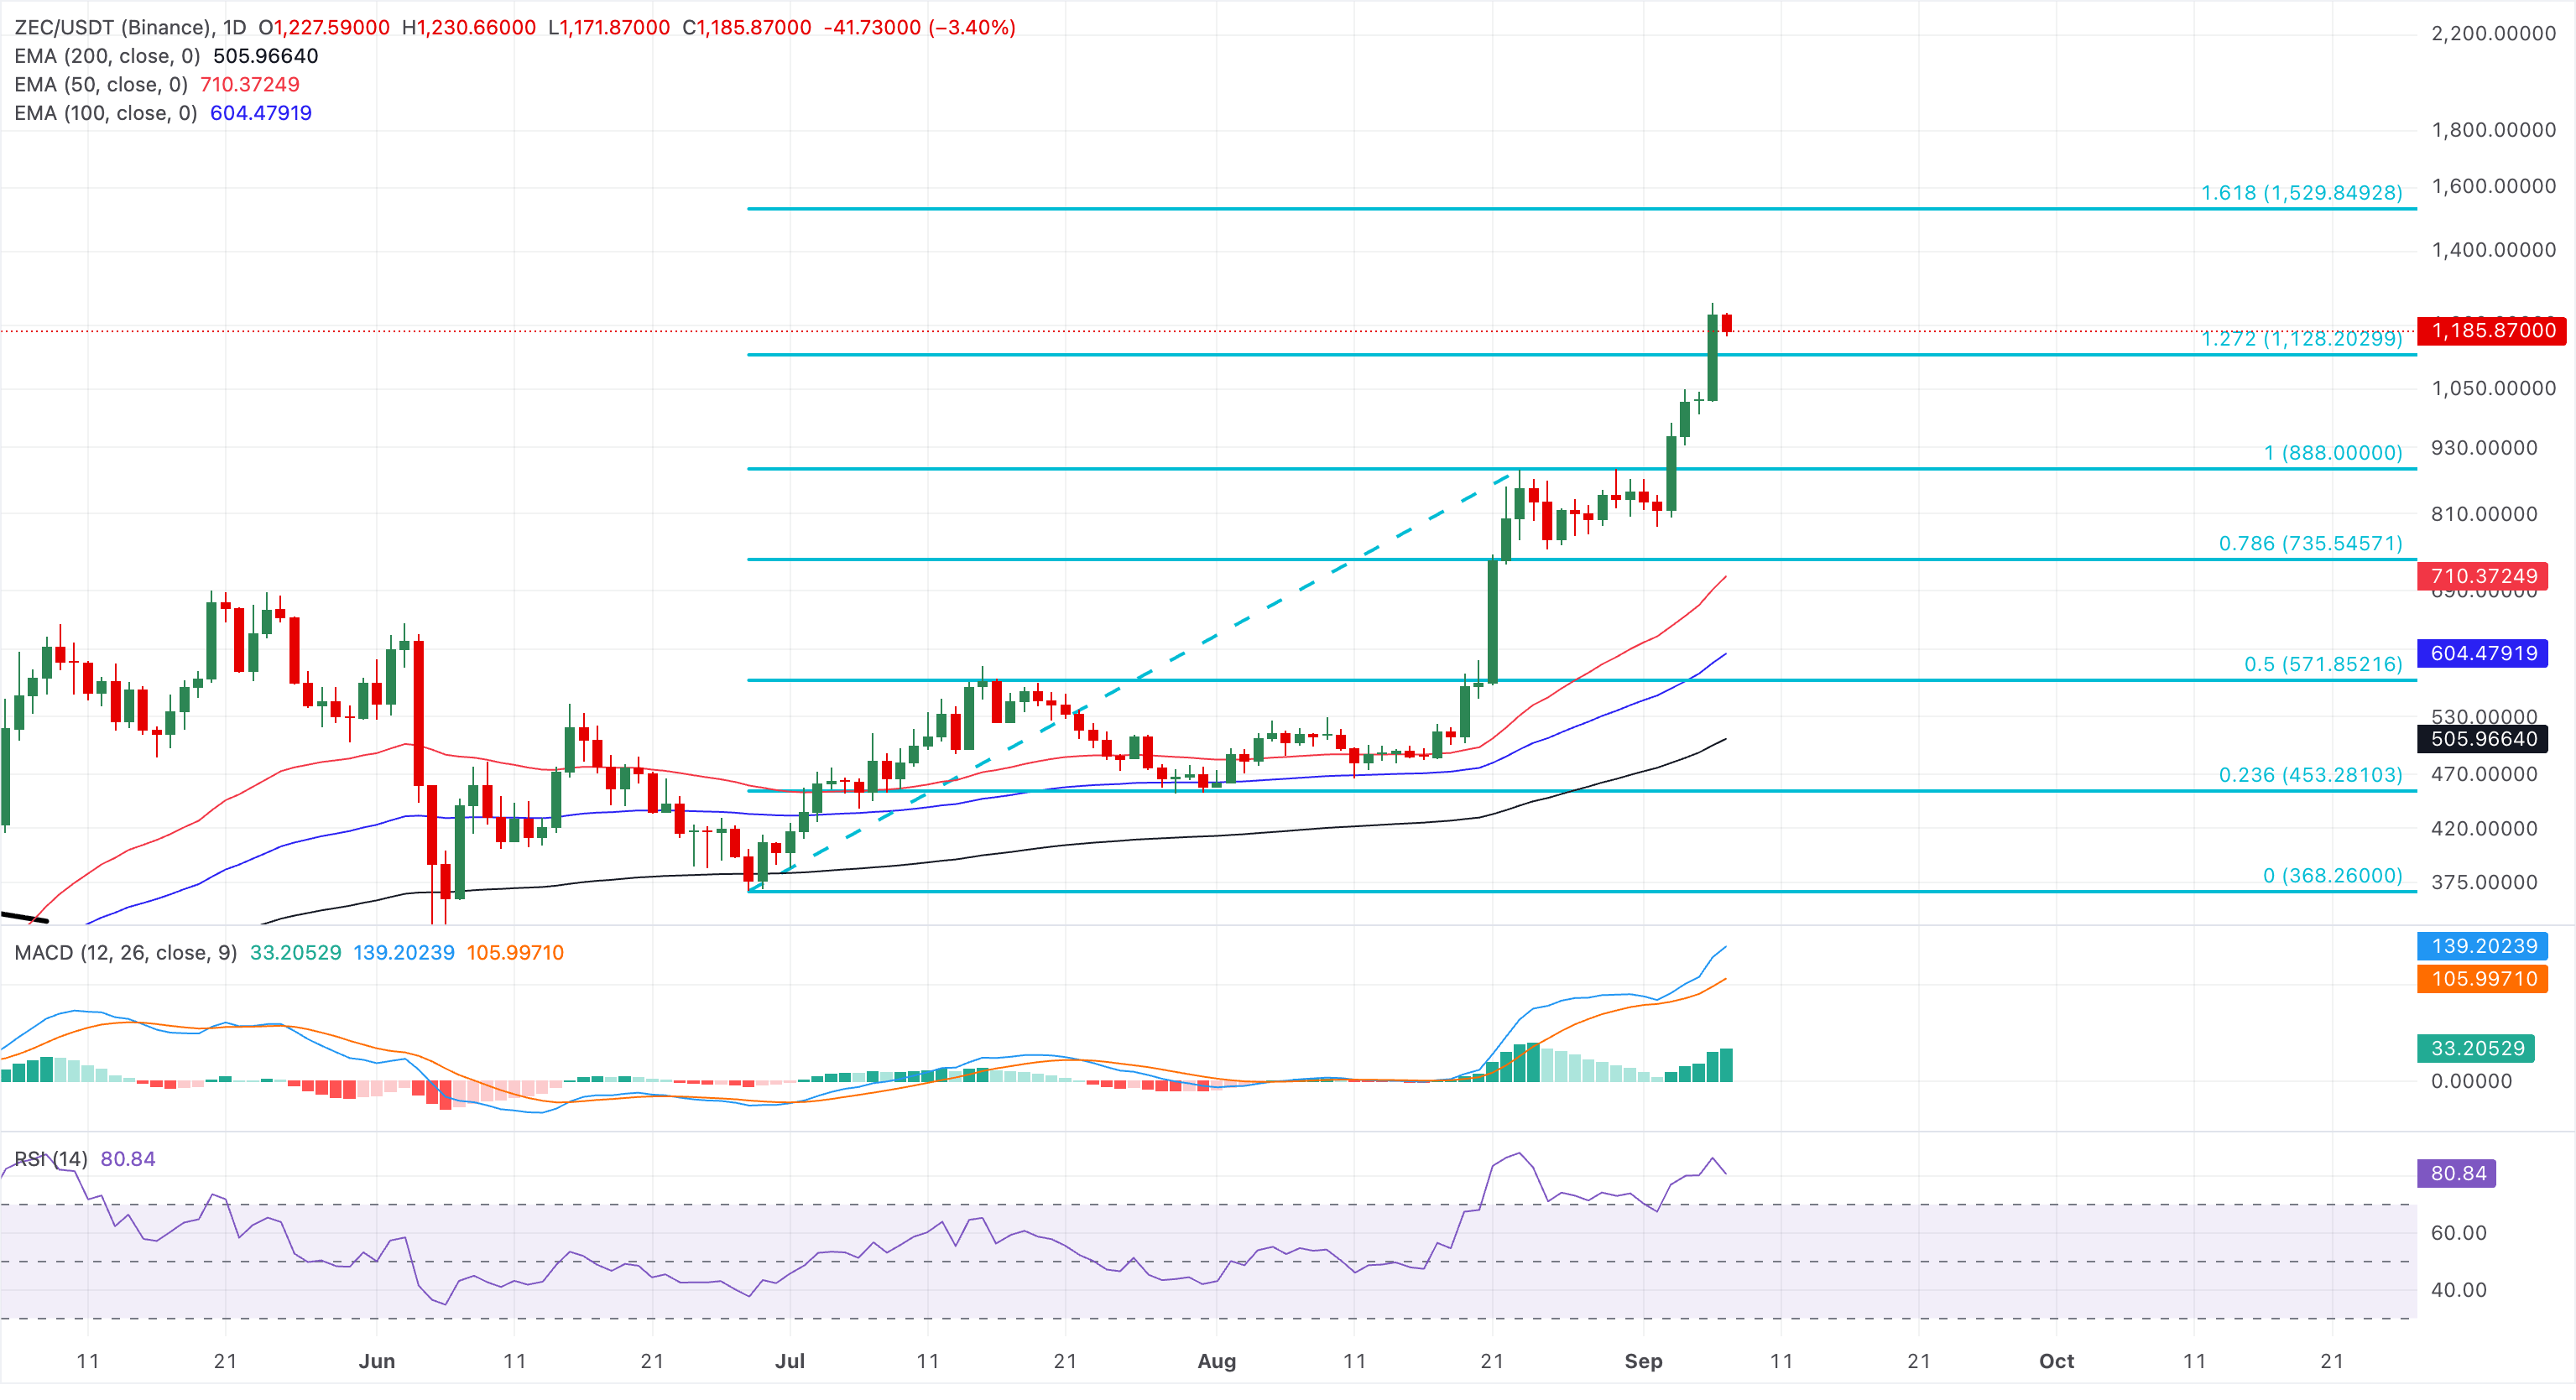
On the downside, initial support is now seen around the reclaimed 127.2% Fibonacci extension level at $1,128, followed by the Fibonacci anchor at $888, with additional demand clustered near the 78.6% retracement at $735.
(The technical analysis of this story was written with the help of an AI tool. Know more.)
Recommended Articles


