

Cardano Price Forecast: Strengthening momentum points to cautious upside extension

Source Fxstreet
  • Cardano trades at $0.222 on Monday after surging over 15% in the previous week.
  • Mixed derivatives metrics and mildly bullish on-chain data suggest a cautious market sentiment.
  • The technical outlook suggests further gains as momentum indicators show signs of strengthening.

Cardano (ADA) trades around $0.222 on Monday after rallying over 15% last week. Mixed derivatives data and mildly bullish on-chain metrics point to cautious market sentiment. Meanwhile, strengthening momentum indicators suggest ADA could see further gains if the recovery continues.

Mixed signals in the derivatives market

Cardano derivatives metrics show a mixed sentiment. CoinGlass’ long-to-short ratio for ADA reads 0.94 on Monday. This ratio above one reflects bearish sentiment, as more traders are betting on Cardano to fall.
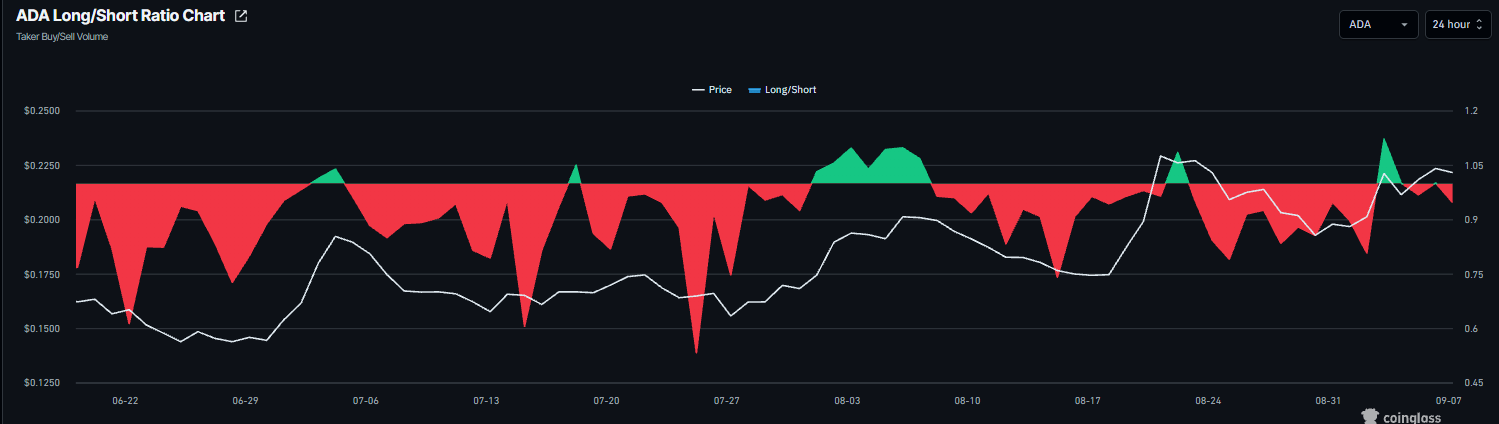
Cardano long-to-short ratio chart. Source: Coinglass

However, funding rates point to a strengthening outlook. CoinGlass’ OI-weighted funding rate data for Cardano flipped positive on Saturday and read 0.0097% on Monday. This positive rate indicates longs are paying shorts and signals a bullish sentiment.
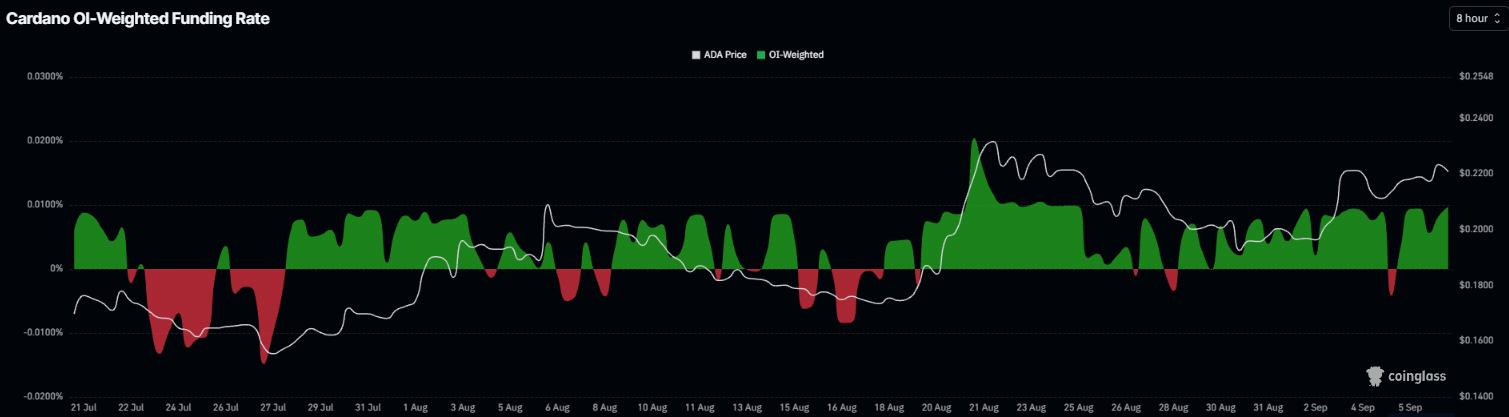
Cardano funding rates chart. Source: Coinglass

On-chain data shows mild bullish bias

CryptoQuant’s summary data shows mild optimism. ADA’s futures markets show large whale orders, while other metrics remain neutral, highlighting a mild bullish bias among traders.
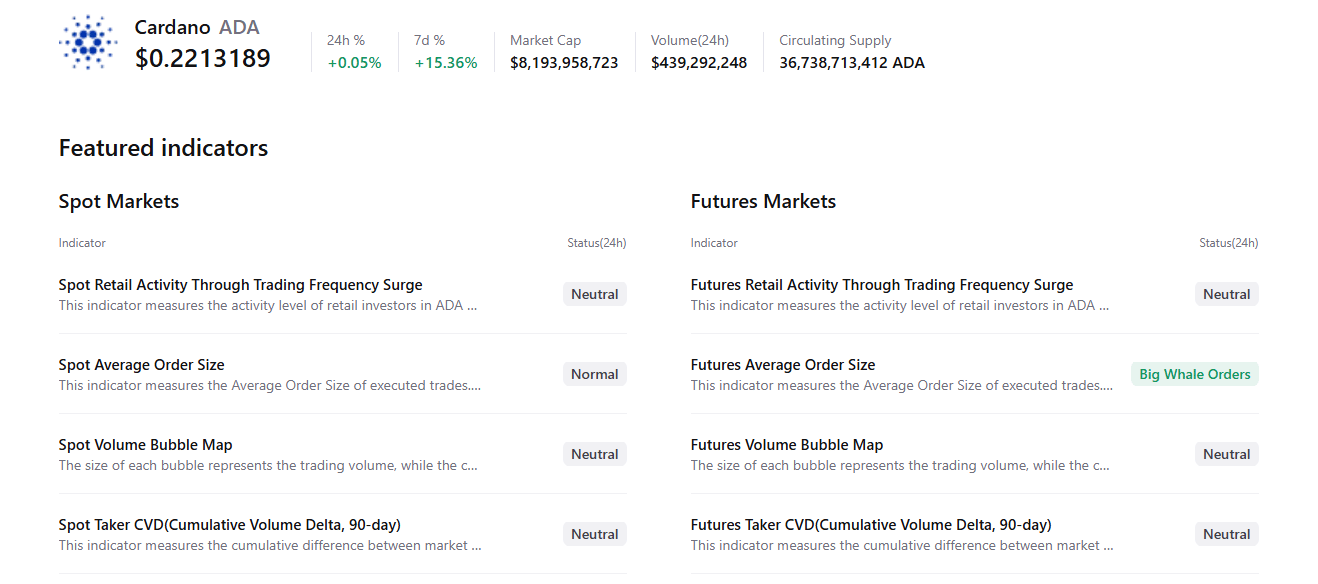
Cardano summary chart. Source: CryptoQuant

Cardano Price Forecast: Momentum indicators show strengthening signs

Cardano price trades at $0.222 on Monday, holding a constructive bullish bias as it extends above the 50-day and 100-day Exponential Moving Averages (EMAs) clustered around $0.200. 

This recovery leg is unfolding with the Relative Strength Index (RSI) hovering near 61, suggesting firm positive momentum. At the same time, the Moving Average Convergence Divergence (MACD) line has turned marginally positive, hinting at a gradual shift in favor of buyers even as the broader downtrend line still looms overhead as dynamic resistance.

On the downside, initial support appears at the 50% retracement near $0.213, with the 100-day EMA around $0.200 and the 50-day EMA just below, reinforced by the 38.2% Fibonacci retracement close to $0.195, forming a broader demand band before deeper support at $0.173 and $0.150.

On the topside, immediate resistance aligns with the 61.8% Fibonacci retracement at about $0.231, followed by a horizontal cap near $0.236 and the 200-day EMA around $0.243, ahead of a stronger barrier at $0.245; a sustained break above this confluence and the descending trendline resistance beyond it would strengthen the case for a more extended corrective advance.
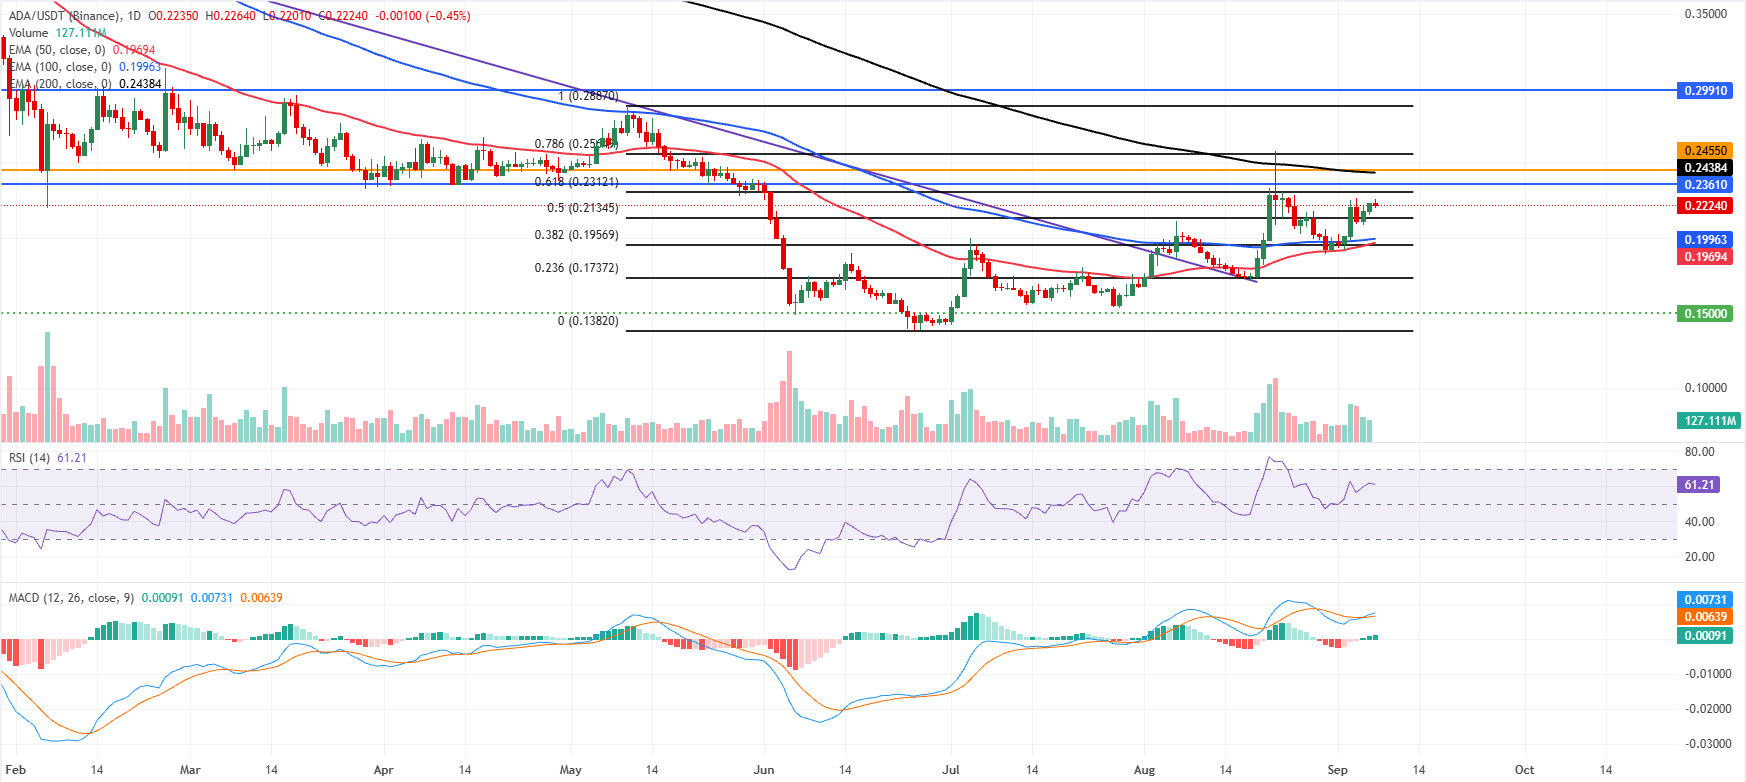
ADA/USDT daily chart

(The technical analysis of this story was written with the help of an AI tool. Know more.)

Disclaimer: For information purposes only. Past performance is not indicative of future results.
placeholder
15 Days After SpaceX Listing, Index Funds Will Take 30% of Floating Shares, What It Means for Retail Investors?TradingKey - SpaceX (SPCX.US) is set to debut on Nasdaq on June 12, targeting a valuation of $1.75 trillion. At that time, only about 3% to 4% of total shares will be freely tradable; with founder sha
Author  Mitrade Team
Jun 10, Wed
TradingKey - SpaceX (SPCX.US) is set to debut on Nasdaq on June 12, targeting a valuation of $1.75 trillion. At that time, only about 3% to 4% of total shares will be freely tradable; with founder sha
placeholder
XRP Price Prediction for July 2026: Can Buyers Finally Break the Downtrend?XRP (XRP) price trades near $1.05, caught between a year-long downtrend and a sudden burst of buying.July has historically rewarded XRP holders. This year the month arrives with on-chain accumulation
Author  Beincrypto
Jun 30, Tue
XRP (XRP) price trades near $1.05, caught between a year-long downtrend and a sudden burst of buying.July has historically rewarded XRP holders. This year the month arrives with on-chain accumulation
placeholder
XAUUSD Gold Analysis: Gold Holds Above $4,350 Ahead of US Inflation Data Is $4,500 Next? Gold holds above $4,350 following weak US jobs data. As inflation reports approach and UBS eyes $5,000, can XAUUSD break resistance at $4,435 to rally toward $4,500?
Author  Naoufal Seddik
Aug 12, Wed
Gold holds above $4,350 following weak US jobs data. As inflation reports approach and UBS eyes $5,000, can XAUUSD break resistance at $4,435 to rally toward $4,500?
placeholder
Gold Price Analysis Today: Gold Drops 1.32% Despite Lower Fed Rate-Hike Bets, Can $4,313 Support Hold? Gold fell 1.32% on August 13 after rising to $4,449.73, then reversing lower and closing near $4,349.918 below the $4,356.46 support. Softer US inflation data reduced Fed rate hike expectations, but selling pressure still dominated the session. Will $4,313 support hold?
Author  Naoufal Seddik
Aug 14, Fri
Gold fell 1.32% on August 13 after rising to $4,449.73, then reversing lower and closing near $4,349.918 below the $4,356.46 support. Softer US inflation data reduced Fed rate hike expectations, but selling pressure still dominated the session. Will $4,313 support hold?
placeholder
Gold Price Analysis Today: Gold Gains 0.94% as Markets Expect Fed to Hold Rates, Can $4,449 Resistance Break? Gold gained 0.94% on August 17, closing near $4,417.30 as softer US data strengthened expectations for unchanged Fed rates in September. Gold remains bullish, with $4,449.730 resistance and $4,310.650 support in focus.
Author  Naoufal Seddik
Aug 18, Tue
Gold gained 0.94% on August 17, closing near $4,417.30 as softer US data strengthened expectations for unchanged Fed rates in September. Gold remains bullish, with $4,449.730 resistance and $4,310.650 support in focus.
Related Instrument
goTop
quote