


Chainlink Price Forecast: LINK hits seven-month highs amid strong DeFi, institutional demand
- Chainlink is up roughly 8% on Friday, pushing the price up over 20% so far this week into double digits.
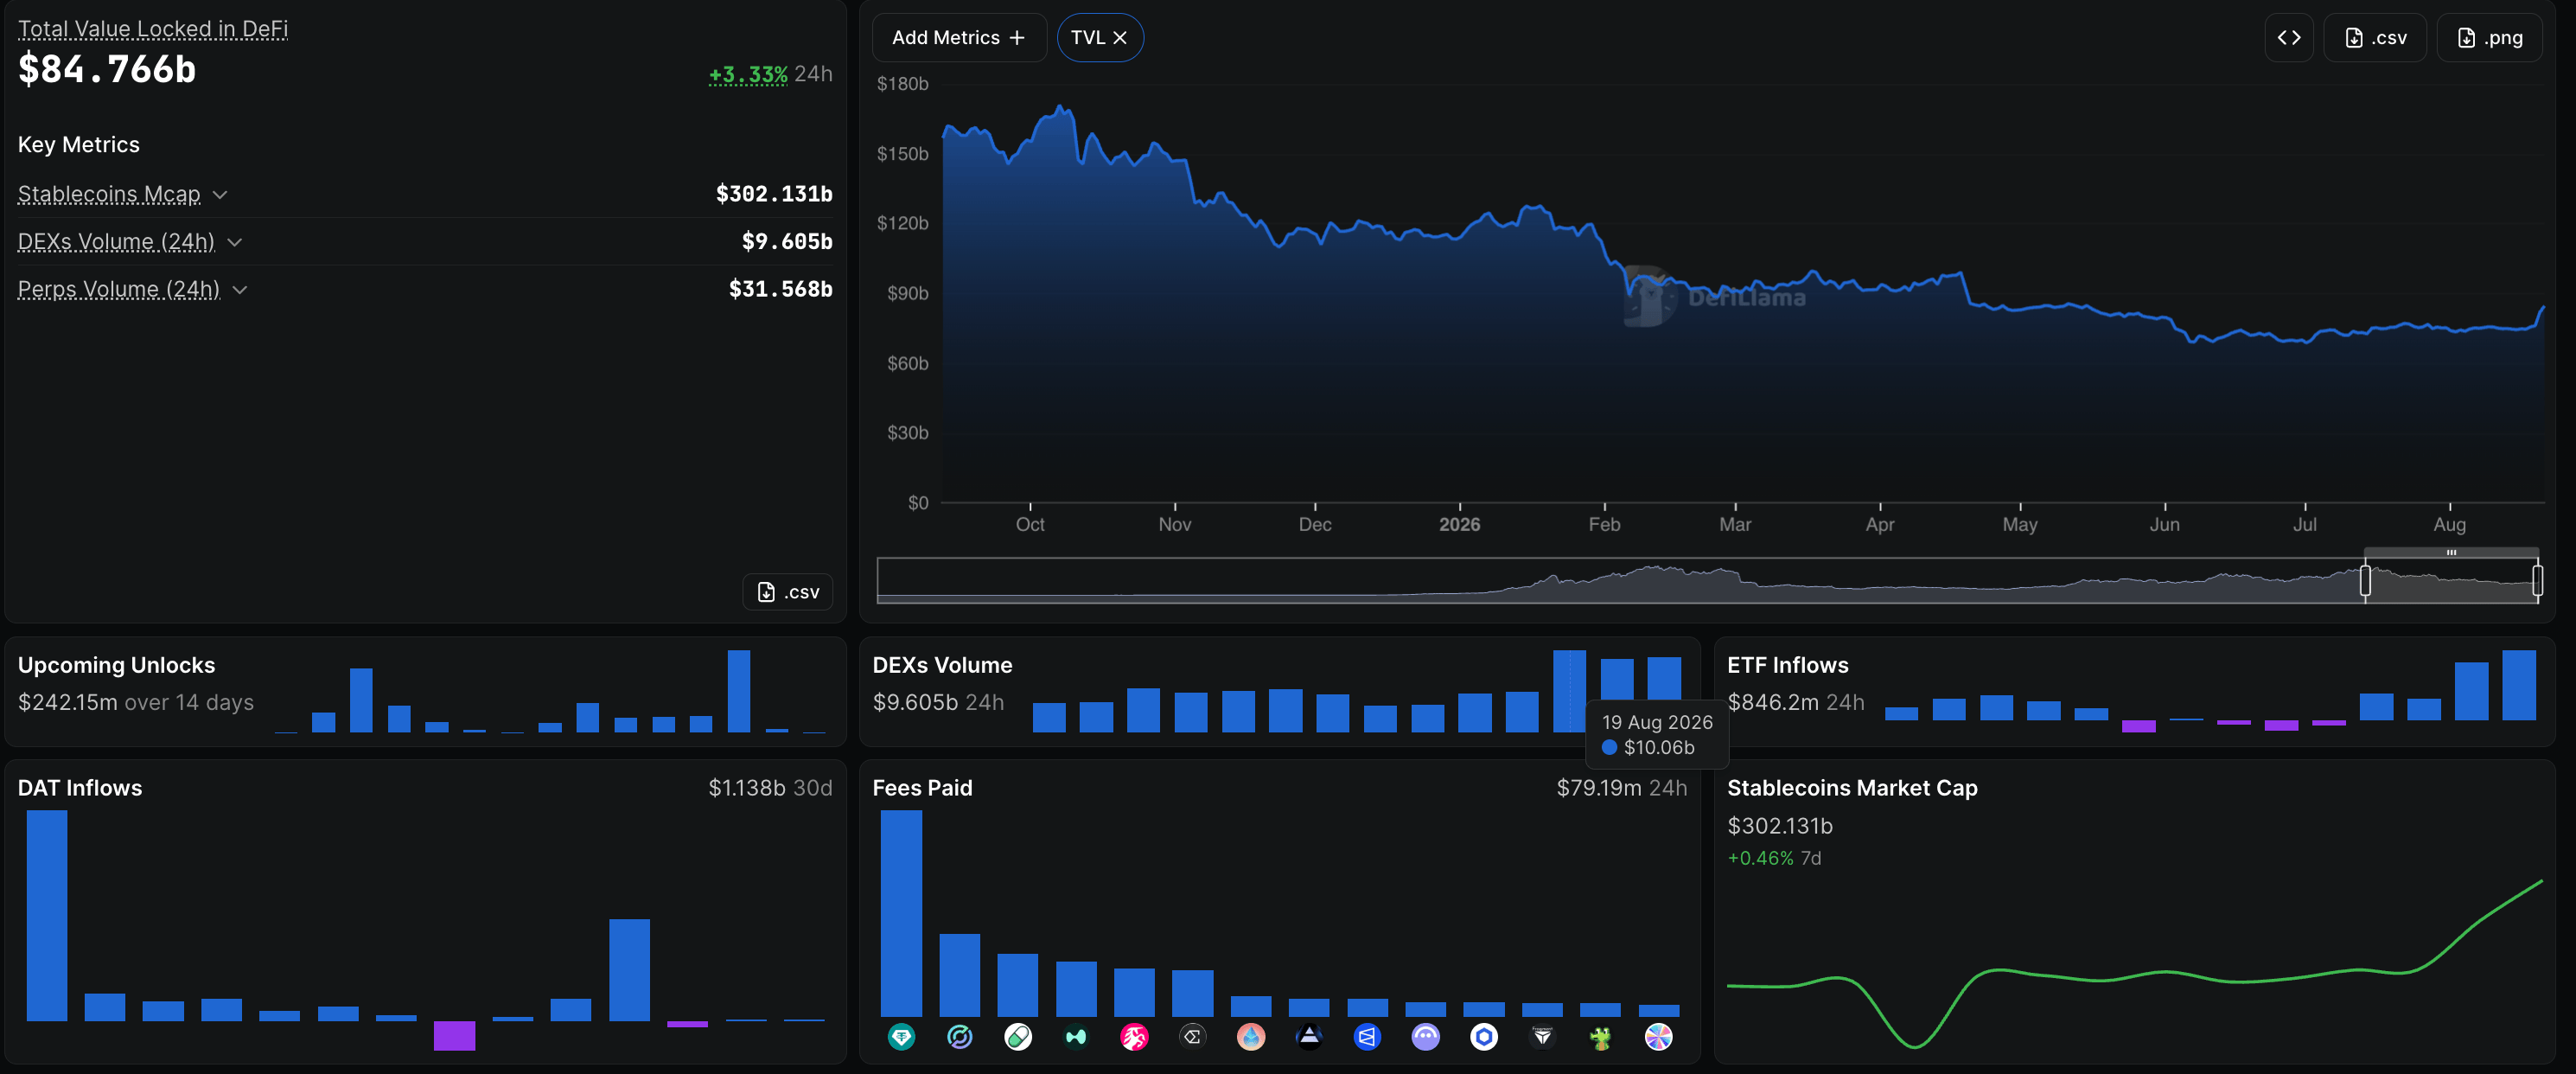
- DeFi ecosystem records daily DEX volume of over $9 billion for three consecutive days as TVL rises to $84.76 billion.
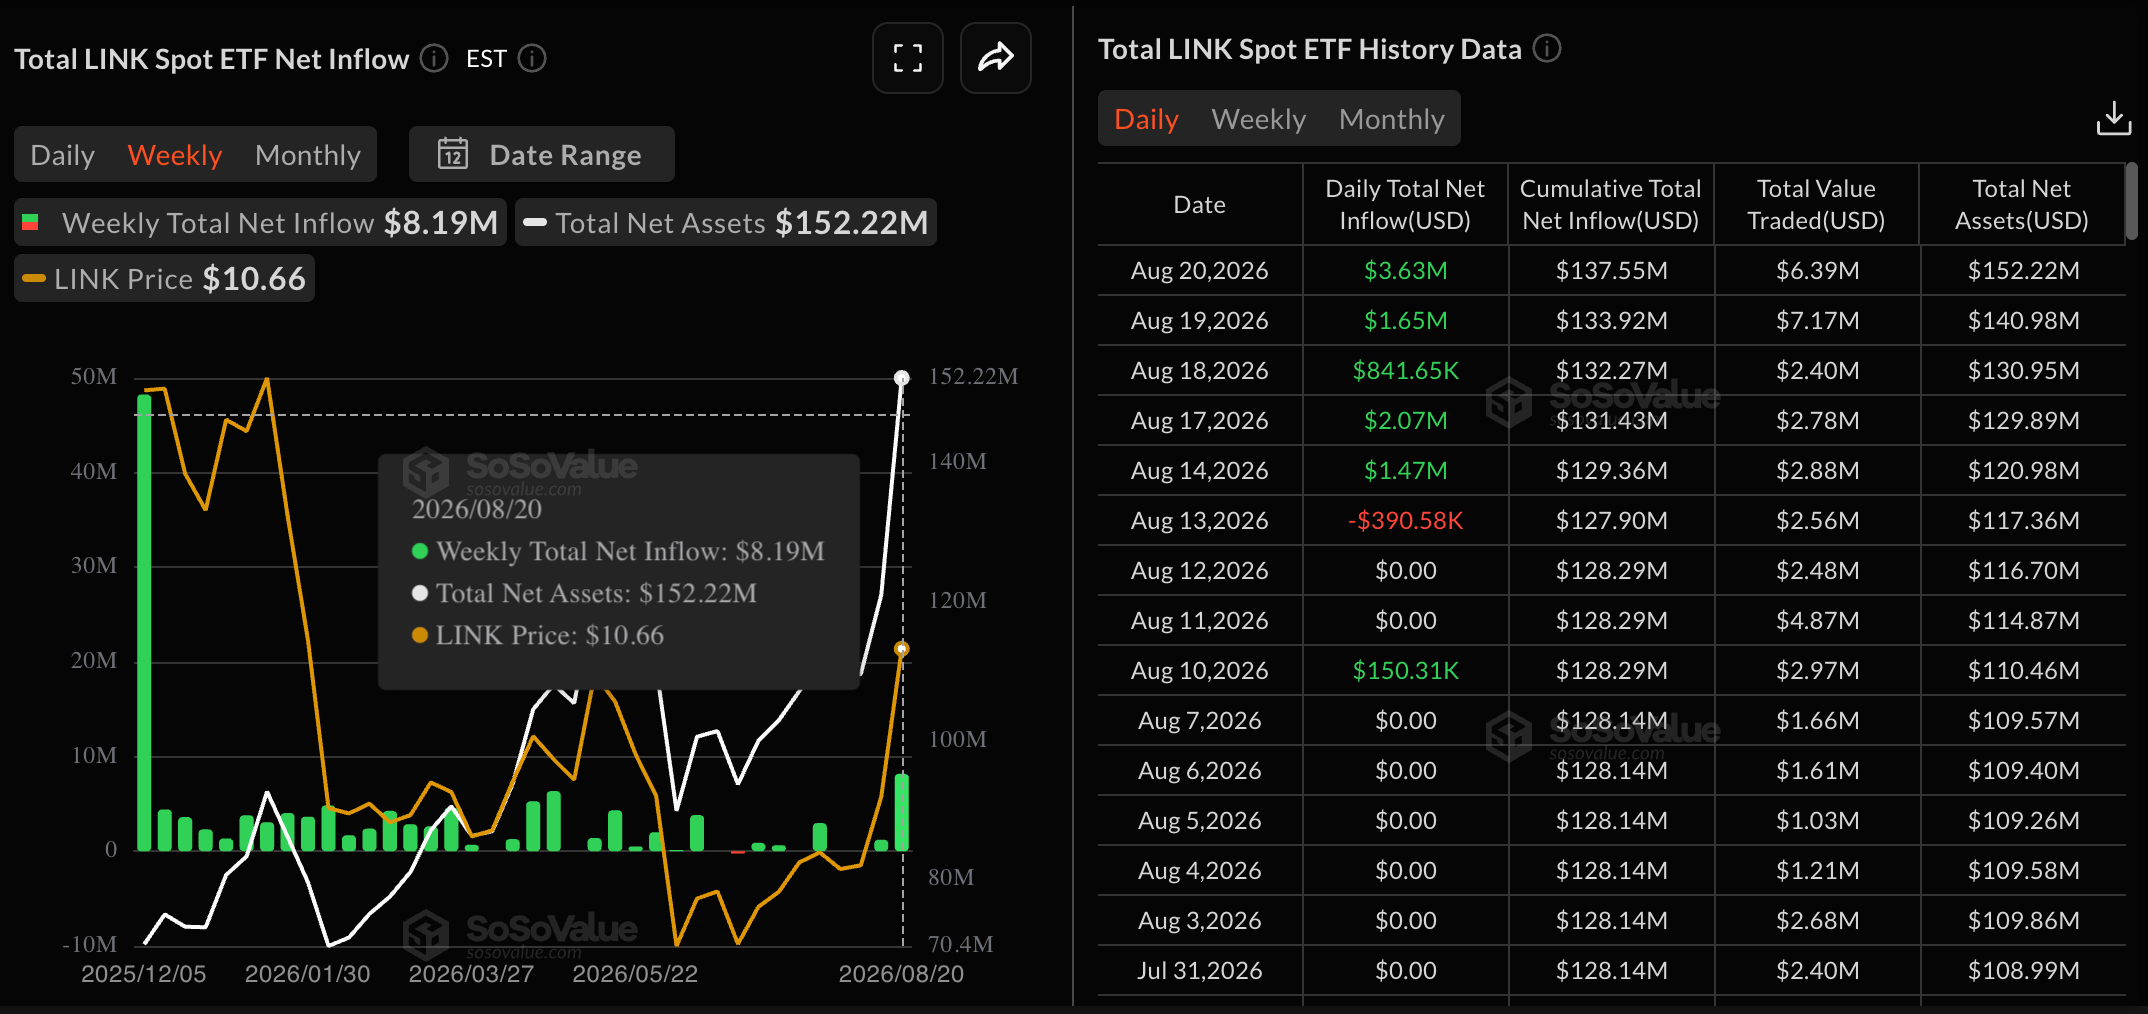
- Chainlink ETFs recorded $3.63 million in inflows on Thursday, driving the weekly inflows above $8 million so far.
Chainlink (LINK) is up roughly 8% at press time on Friday, extending its rally to a seven-month high with over 20% so far this week. Decentralized Finance (DeFi) ecosystem recorded over $9 billion in volume for three straight days, while LINK-focused Exchange Traded Funds (ETFs) recorded their four-month highest daily inflow of $3.63 million on Thursday, pointing to strong market activity and investor demand. Chainlink’s technical outlook is bullish with 10% upside potential amid firm buying pressure.
Broader market recovery fuels DeFi growth
The broader cryptocurrency market shows a steady recovery this week, with Bitcoin (BTC) climbing above $77,000 and the DeFi ecosystem's Total Value Locked (TVL) rising to $84.76 billion, from $74.73 billion on Monday. This increase in TVL reflects increased user deposits on DeFi protocols, many of which integrate Chainlink’s Cross-Chain Interoperability Protocol (CCIP) for price feeds. Meanwhile, the Decentralized Exchange (DEX) volume has been above $9 billion over the last three days, suggesting increased activity in the DeFi market.
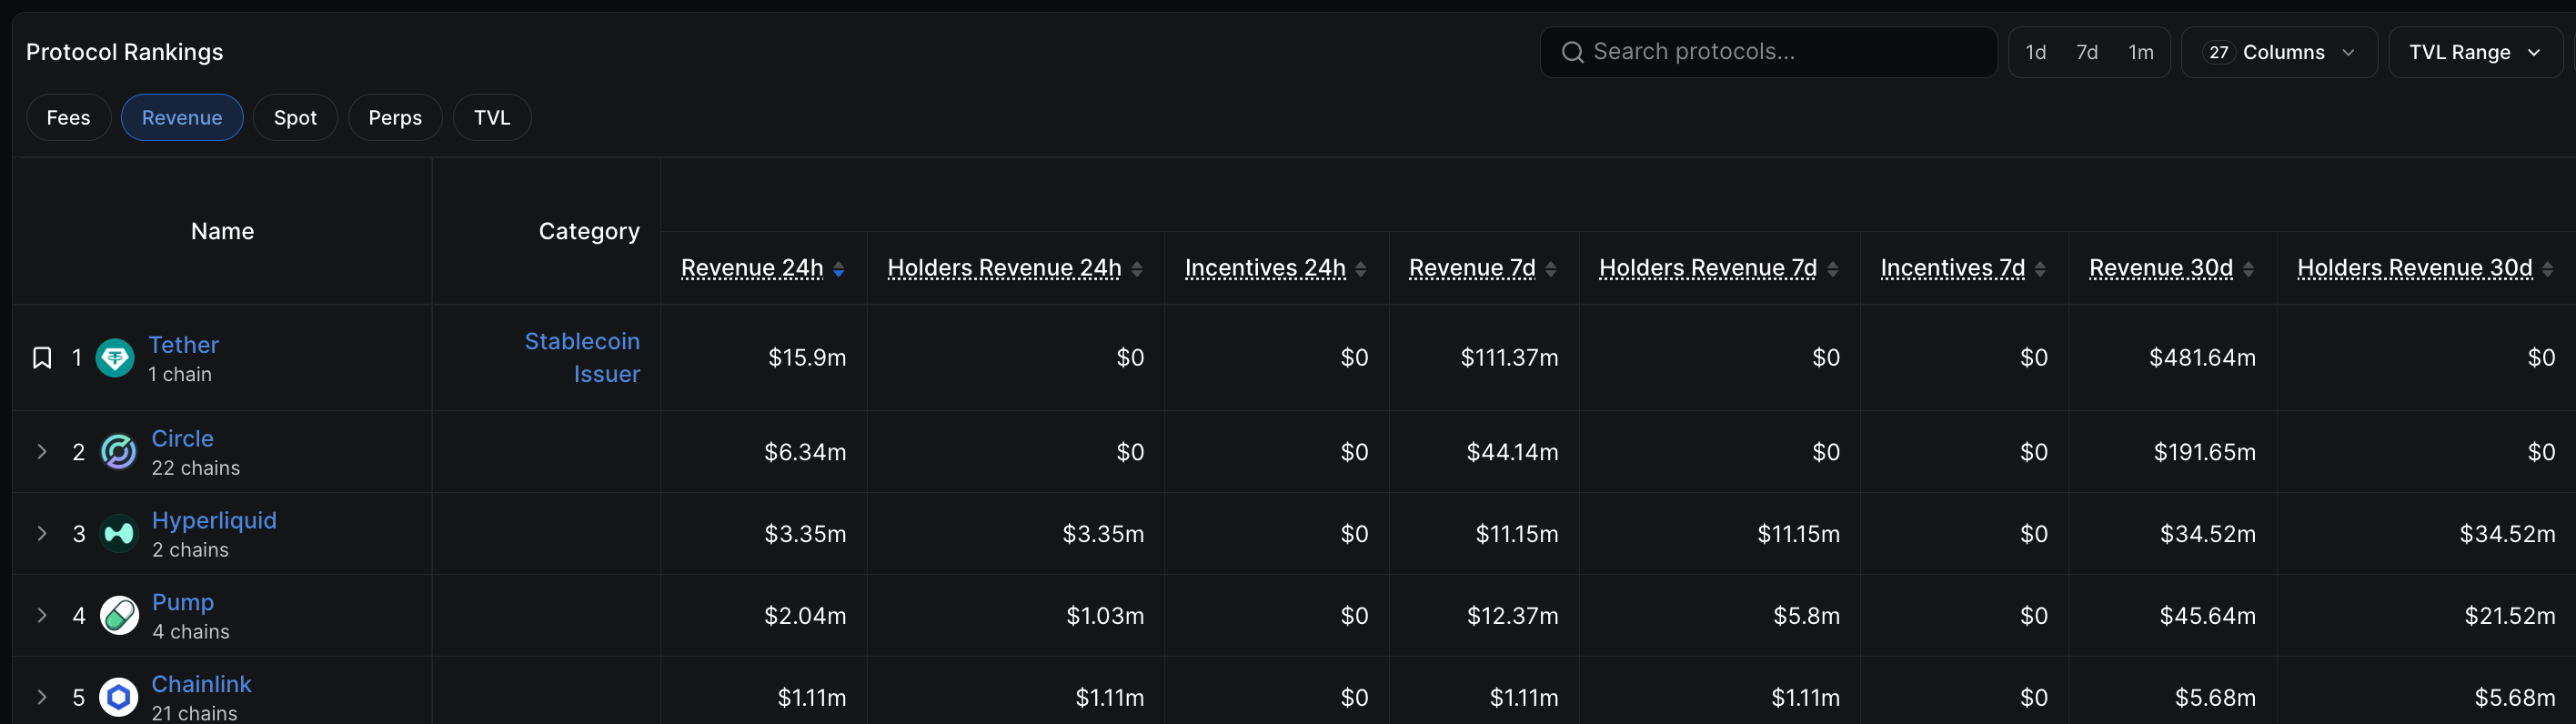
DeFiLlama data shows Chainlink ranking as the fifth-largest DeFi Protocol by 24-hour revenue at $1.11 million, behind Tether, Circle, Hyperliquid, and Pump.fun.
Chainlink ETF inflows hit a four-month daily high
Institutional investors are increasing their exposure to crypto assets following the US Treasury liquidity boost. Chainlink ETFs recorded $3.63 million in inflows on Thursday, marking their highest daily inflow since April 23. The weekly inflows have risen to $8.19 million so far, likely to be the second-highest since inception.
Technical outlook: Will Chainlink extend its rally?
Chainlink trades around $11.50 on Friday, extending a strong bullish phase above both the 50-day Exponential Moving Average (EMA) at $8.78 and the 200-day EMA at $9.60, which now underpin the broader uptrend. LINK has also pushed through the 50% retracement level of the downswing from $15.01 to $6.99 at $10.24, suggesting buyers remain in control.
Steady recovery in LINK could face headwinds near the 78.6% Fibonacci retracement at $12.74. A confirmed breakout above this level could extend the rally toward the $15.01 swing high.
Bullish momentum is stretched, as the Relative Strength Index (RSI) at 85 on the daily chart sits deep in overbought territory. At the same time, the Moving Average Convergence Divergence (MACD) shows a rising positive slope above its signal line and a growing positive histogram, hinting that upside pressure persists.
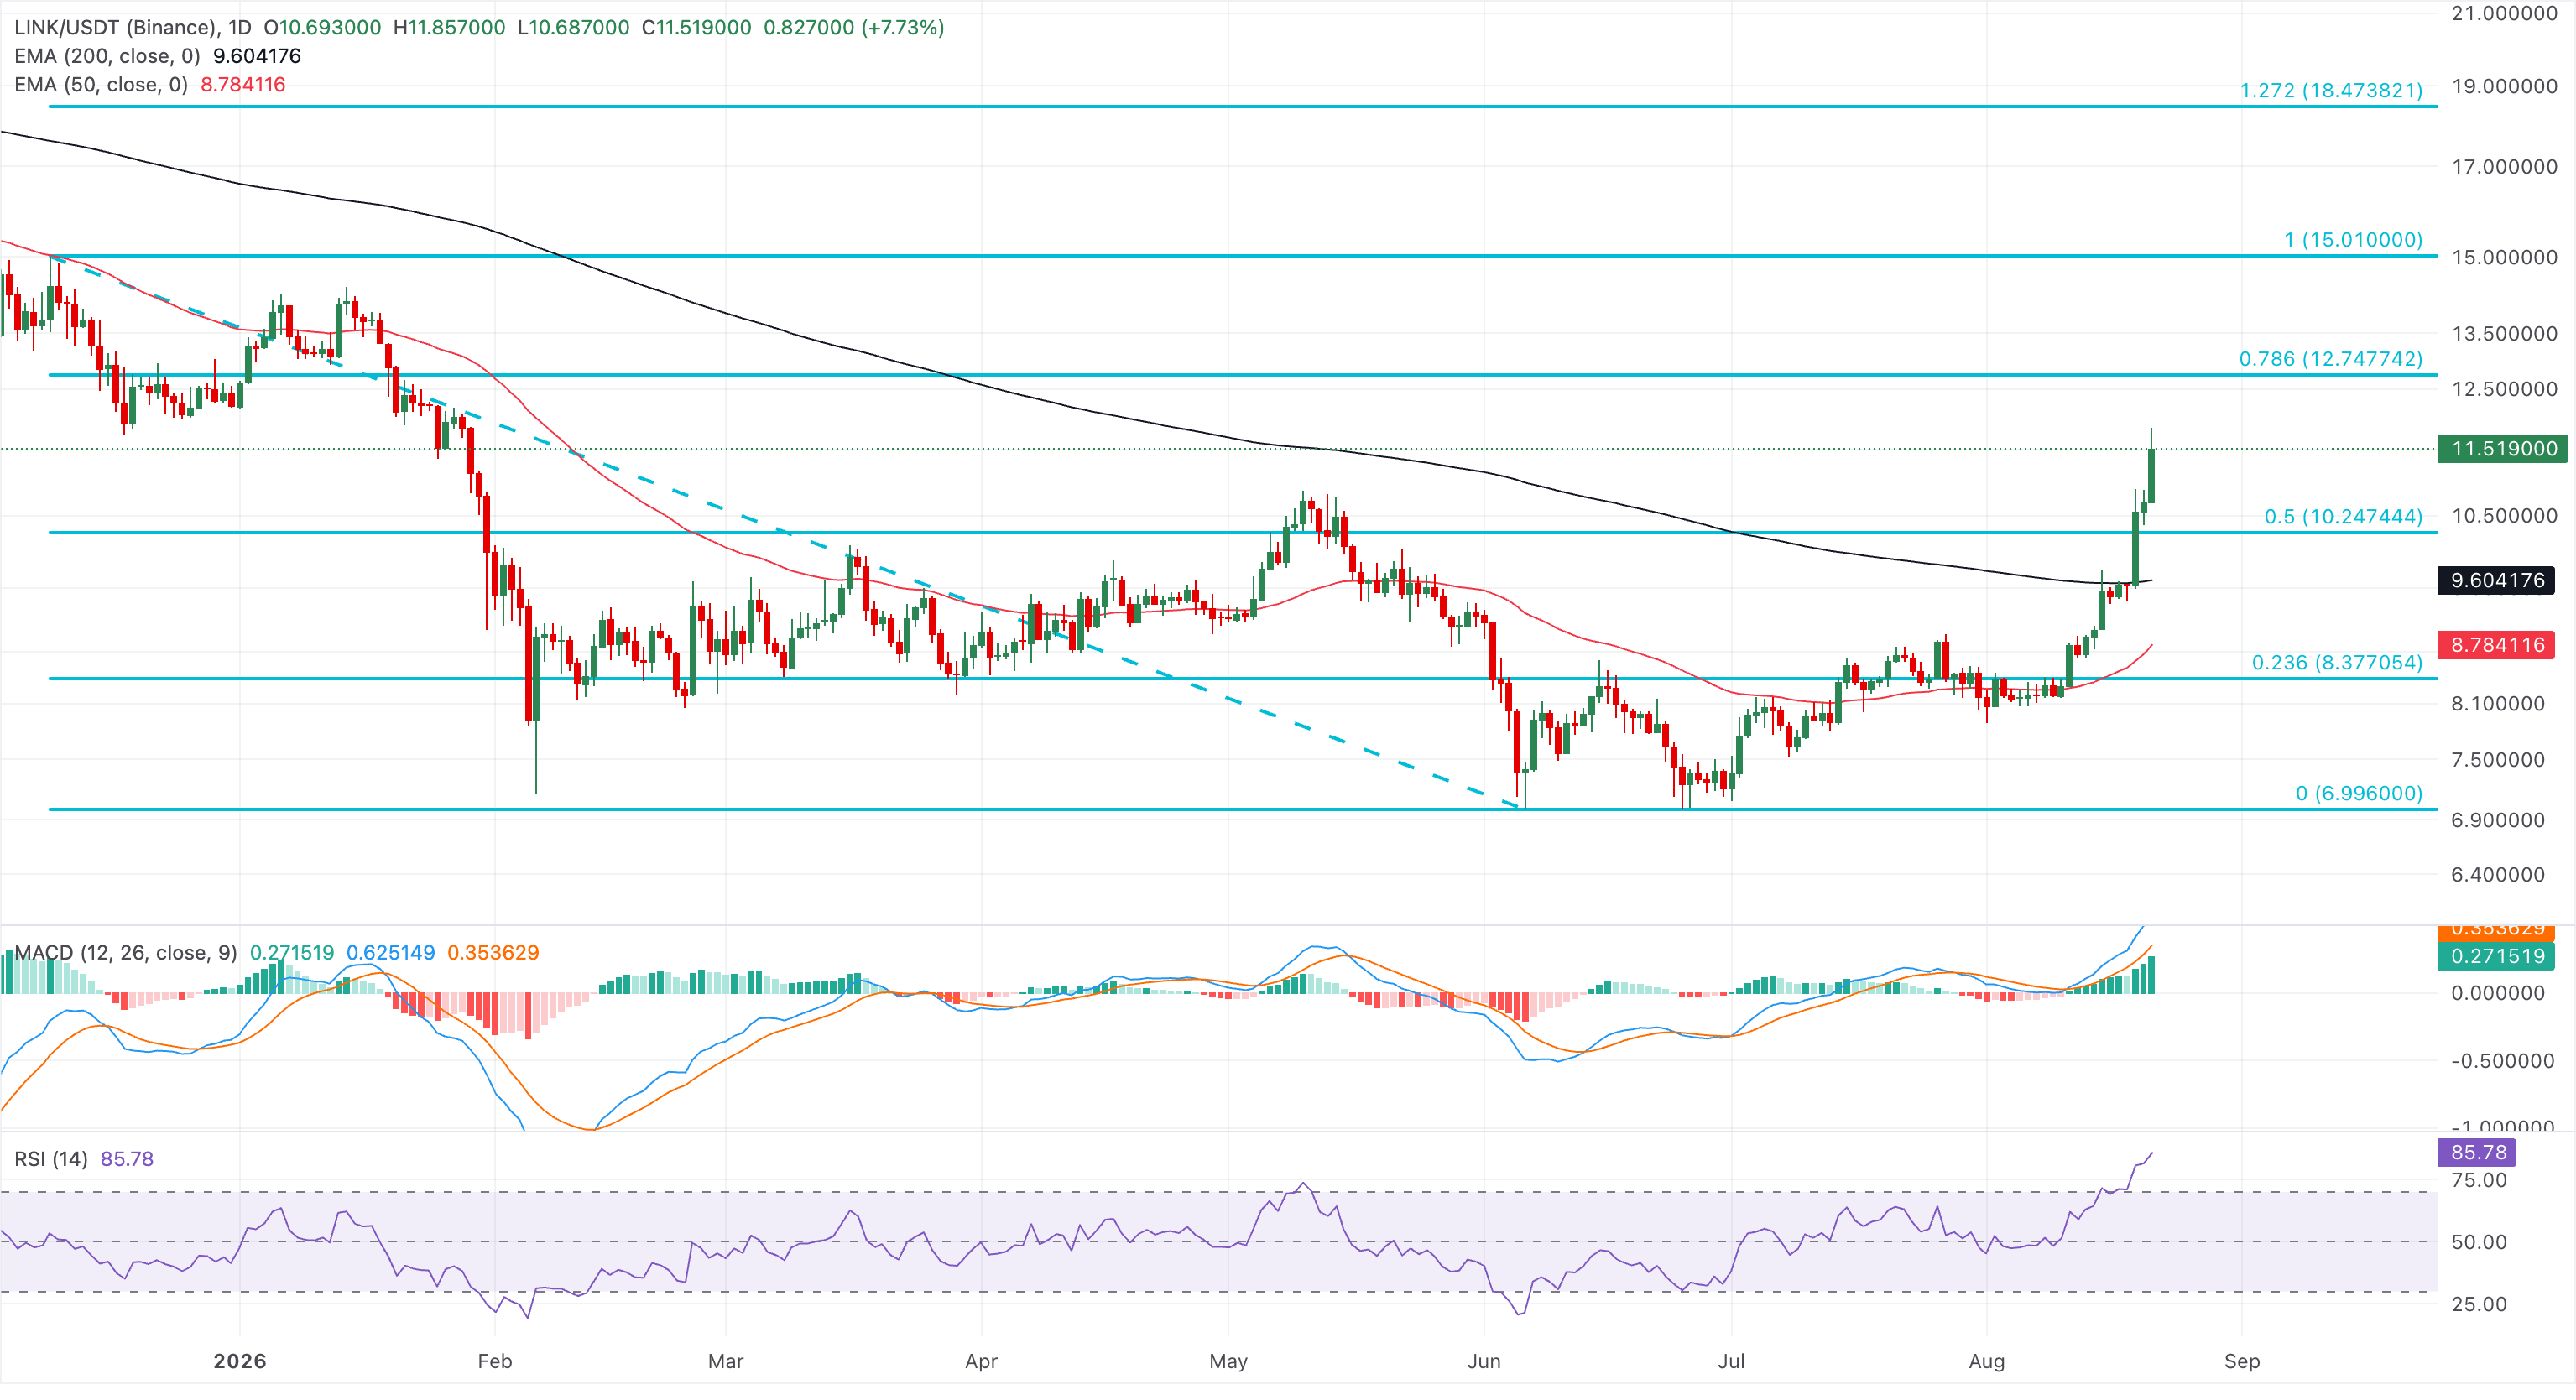
On the downside, initial support is located at the 50% retracement level at $10.24, ahead of the 200-day EMA at $9.60. Deeper pullbacks would likely attract buyers near the 50-day EMA at $8.78, while only a break toward the structural low around $7.00 would seriously undermine the current bullish bias.
(The technical analysis of this story was written with the help of an AI tool. Know more.)
Recommended Articles


