


Crypto Overview: GRAM declines as iOS removes Telegram, SOL rises on new catalysts
- GRAM token extends losses on Tuesday as the iOS App Store removes Telegram worldwide.
- Algorand edges higher on Tuesday, extending its 5% gains from the previous day.
- Solana shows upside potential amid BlackRock's filing to issue tokenized fund shares, Double Disinflation proposal, and refreshed memecoin demand.
The GRAM (GRAM) token is extending losses on Tuesday as Apple pulled Telegram from its iOS App Store worldwide, while Algorand (ALGO) emerges as the top-performing crypto, extending its 5% gains from the previous day.
Solana (SOL) holds steady amid emerging bullish signs, including BlackRock's filing to issue tokenized fund shares, the Double Disinflation proposal, and renewed demand in its memecoin ecosystem.
Telegram’s exit from the App Store weighs on GRAM
Telegram has been removed from the iOS App Store worldwide, while neither Apple nor Telegram has issued an official statement. The GRAM token is down 3% at press time on Tuesday, after briefly dropping to $1.29 early in the day.
From a technical perspective, GRAM shows a contracting price trend, forming a falling wedge pattern on the daily chart. The Relative Strength Index (RSI) at around 37 indicates firm bearish momentum, with further downside room before reaching oversold conditions.
A decisive close above the overhead trend line near $1.44 could open the path toward the center pivot and R1 pivot levels at $1.53 and $1.71, respectively.
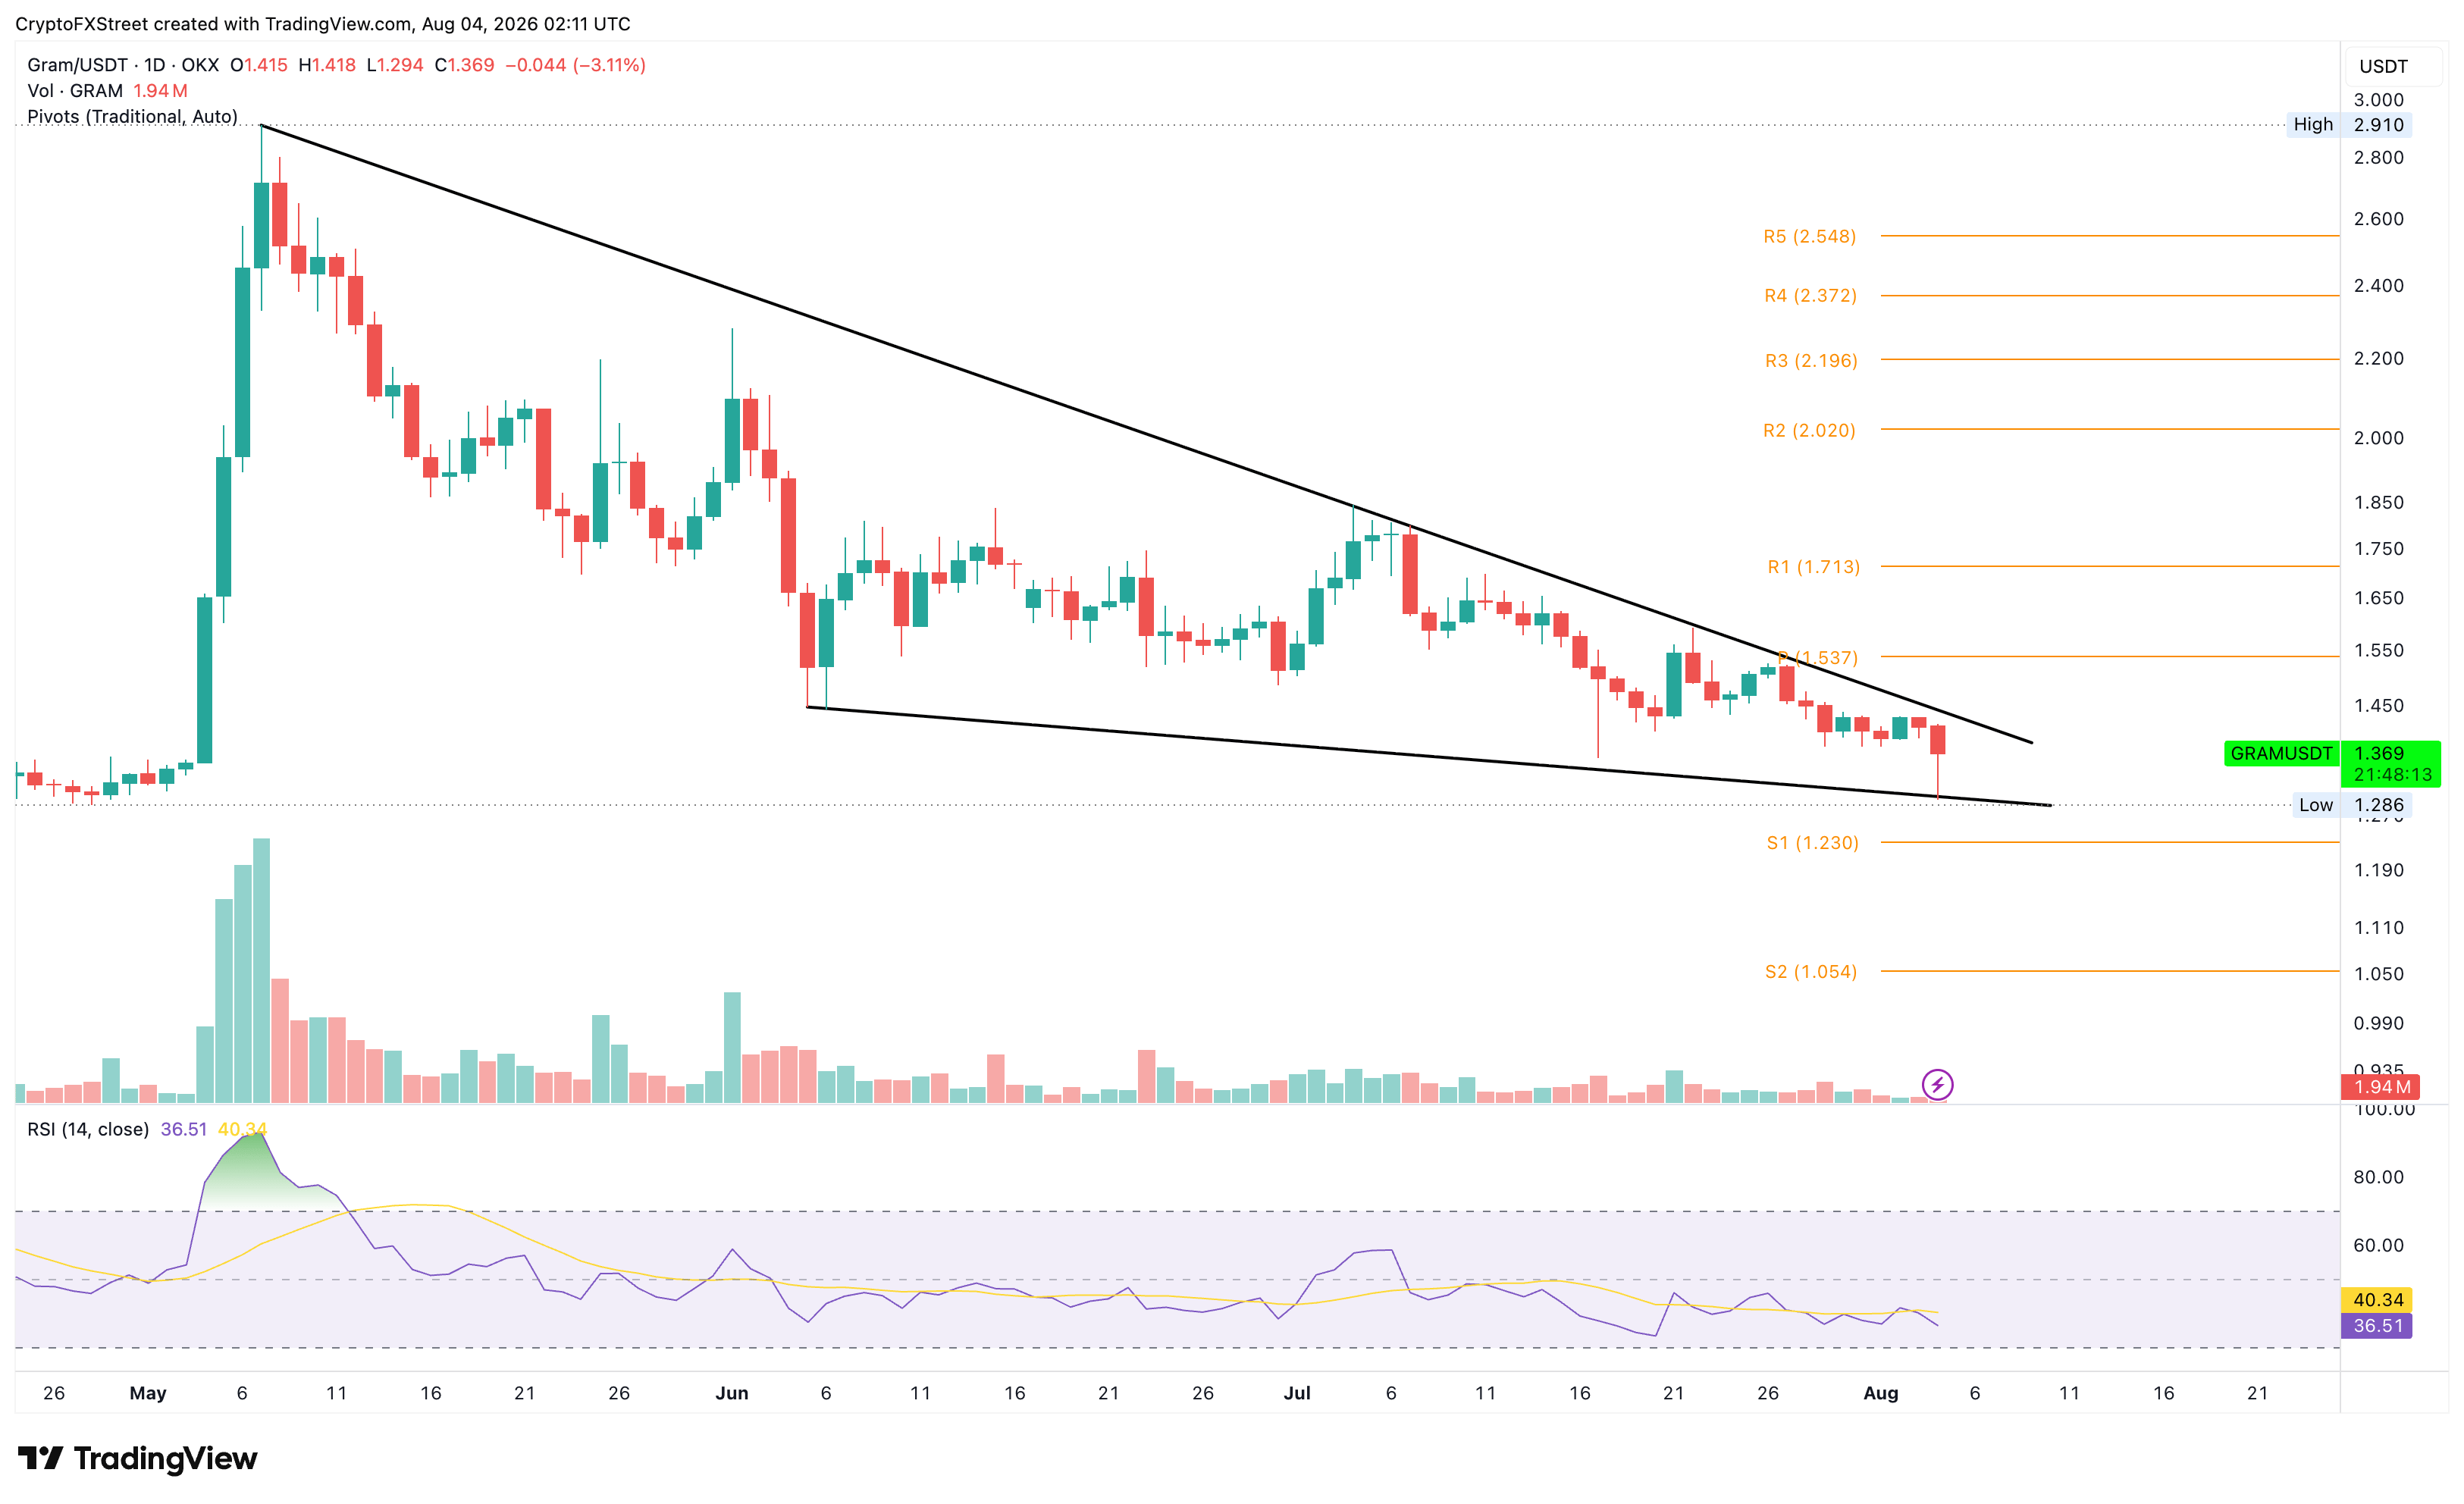
Looking down, a sustained daily close below $1.29 would confirm the bearish breakout. The S1 and S2 pivot levels at $1.23 and $1.05, respectively, serve as crucial support levels.
Bearish momentum eases in Solana amid new bullish catalysts
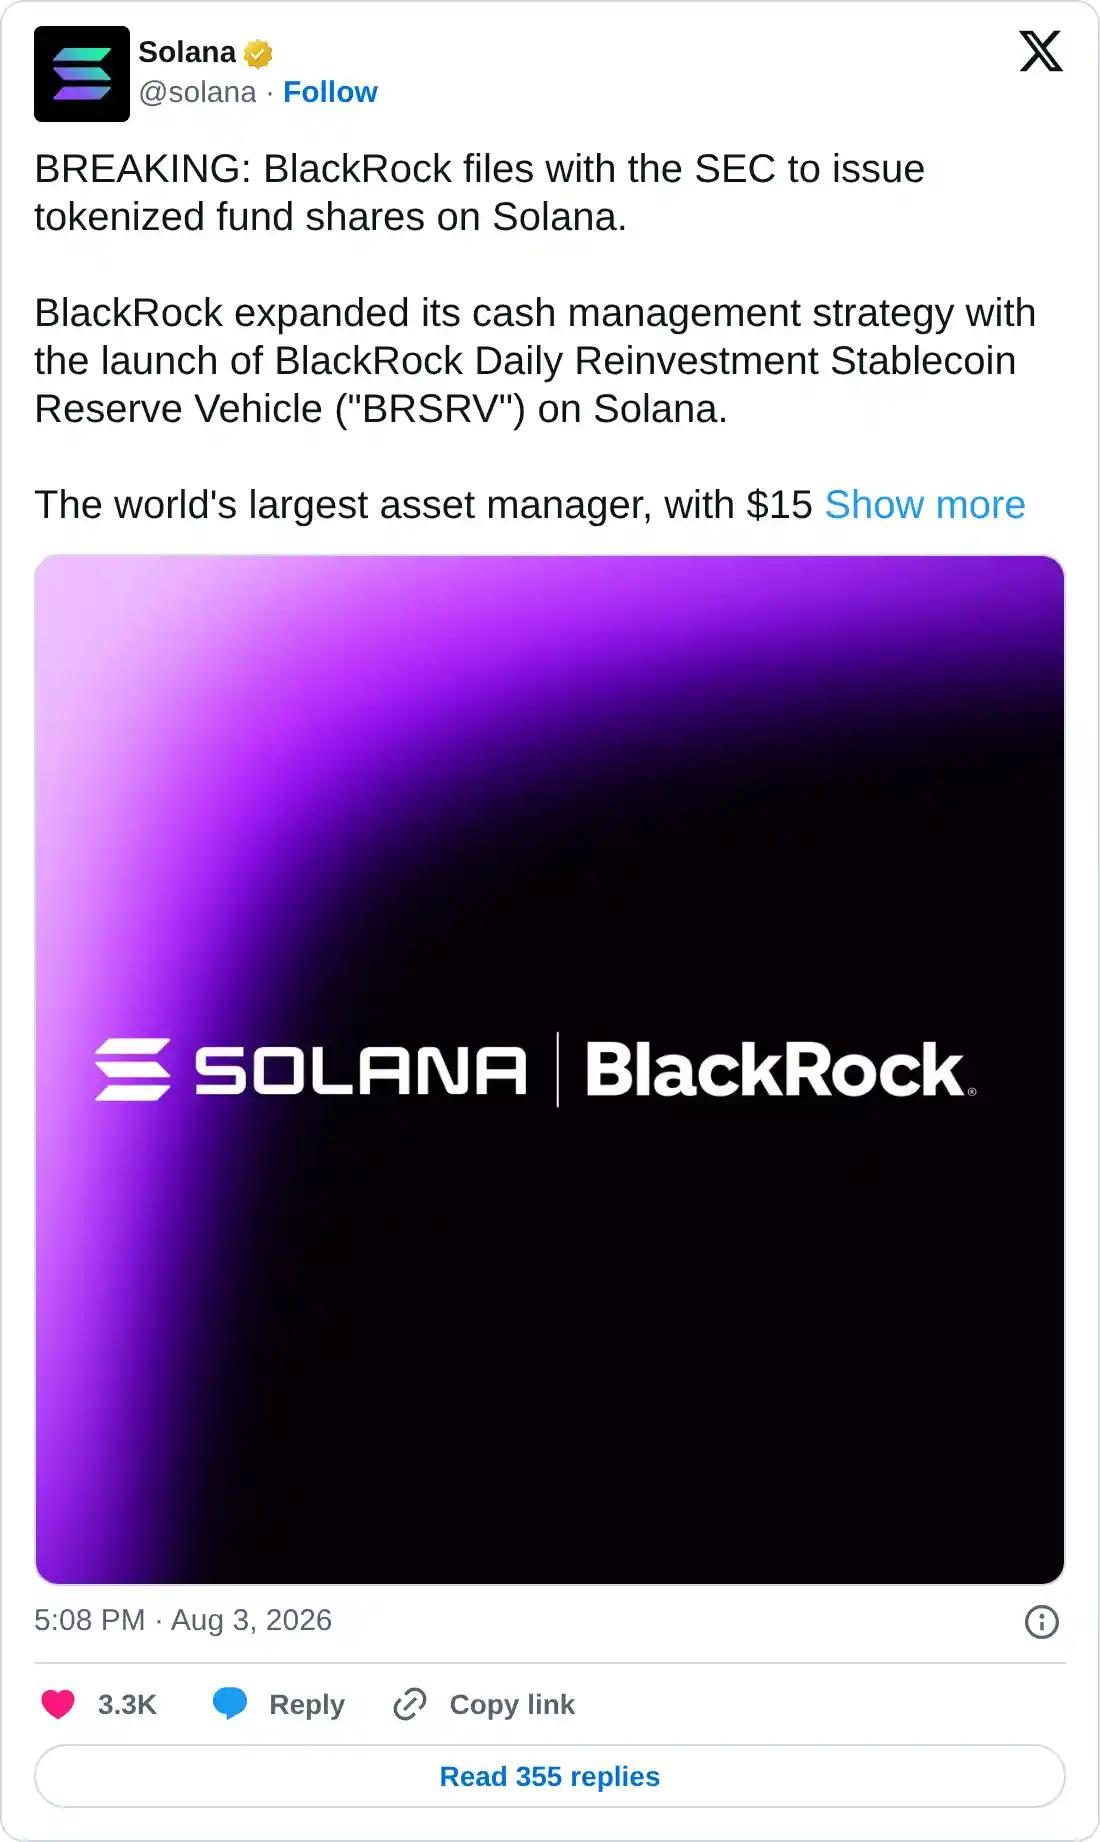
BlackRock filed with the U.S. Securities and Exchange Commission (SEC) to issue tokenized fund shares on the Solana network. BlackRock plans to launch the Daily Reinvestment Stablecoin Reserve Vehicle (BRSRV), which would boost stablecoin reserves on Solana.
In addition, the ongoing Double Disinflation Proposal is live on Solana and aims to reduce long-term sell pressure by doubling the disinflation rate to 30% from the current 15%. The SIMD-0550 proposal requires 10% of active stake to advance to achieve a full governance vote.
Finally, the Solana memecoin ecosystem is heating up, with the Cate memecoin reaching a market cap of $73 million within 8 days of its launch and $40 million in 24-hour trading volume. The memecoin ecosystem reflects a renewed demand and risk appetite in the Solana ecosystem.
SOL maintains a mixed near-term tone, holding steady below the 50-day Exponential Moving Average (EMA) at $75.63 and the 200-day EMA at $91.19. SOL remains under the downward resistance trendline at $75.81, suggesting that recent rebounds are still capped.
The RSI around 46 maintains a broadly neutral tone while the Moving Average Convergence Divergence (MACD) is marginally below its signal and zero lines, hinting at subdued momentum.
For a sustained recovery, SOL must clear above the 50-day EMA at $75.63, which could open the path toward the 200-day EMA at $91.19.
On the downside, a close below the descending support trendline near $71.50 could extend the decline to the February 6 low at $67.50.
Technical outlook: Will Algorand price reclaim $0.10?
Algorand edges higher on Tuesday, extending its rebound from the recent record low of $0.0757. At the time of writing, ALGO trades above the 50-period EMA at $0.0875, which now underpins a constructive near-term bias. The pair remains well below the longer-term 200-period EMA at $0.1096, capping the broader trend.
Momentum shows early signs of recovery as the MACD rises above its signal line, turning the histogram reading positive while the RSI climbs to 63, inching toward the overbought area. Taken together, the indicators hint at firm bullish pressure in the short term.
On the topside, initial resistance aligns with the May 8 high of $0.1000, ahead of the broader structural barrier at the 200-period EMA at $0.1096.
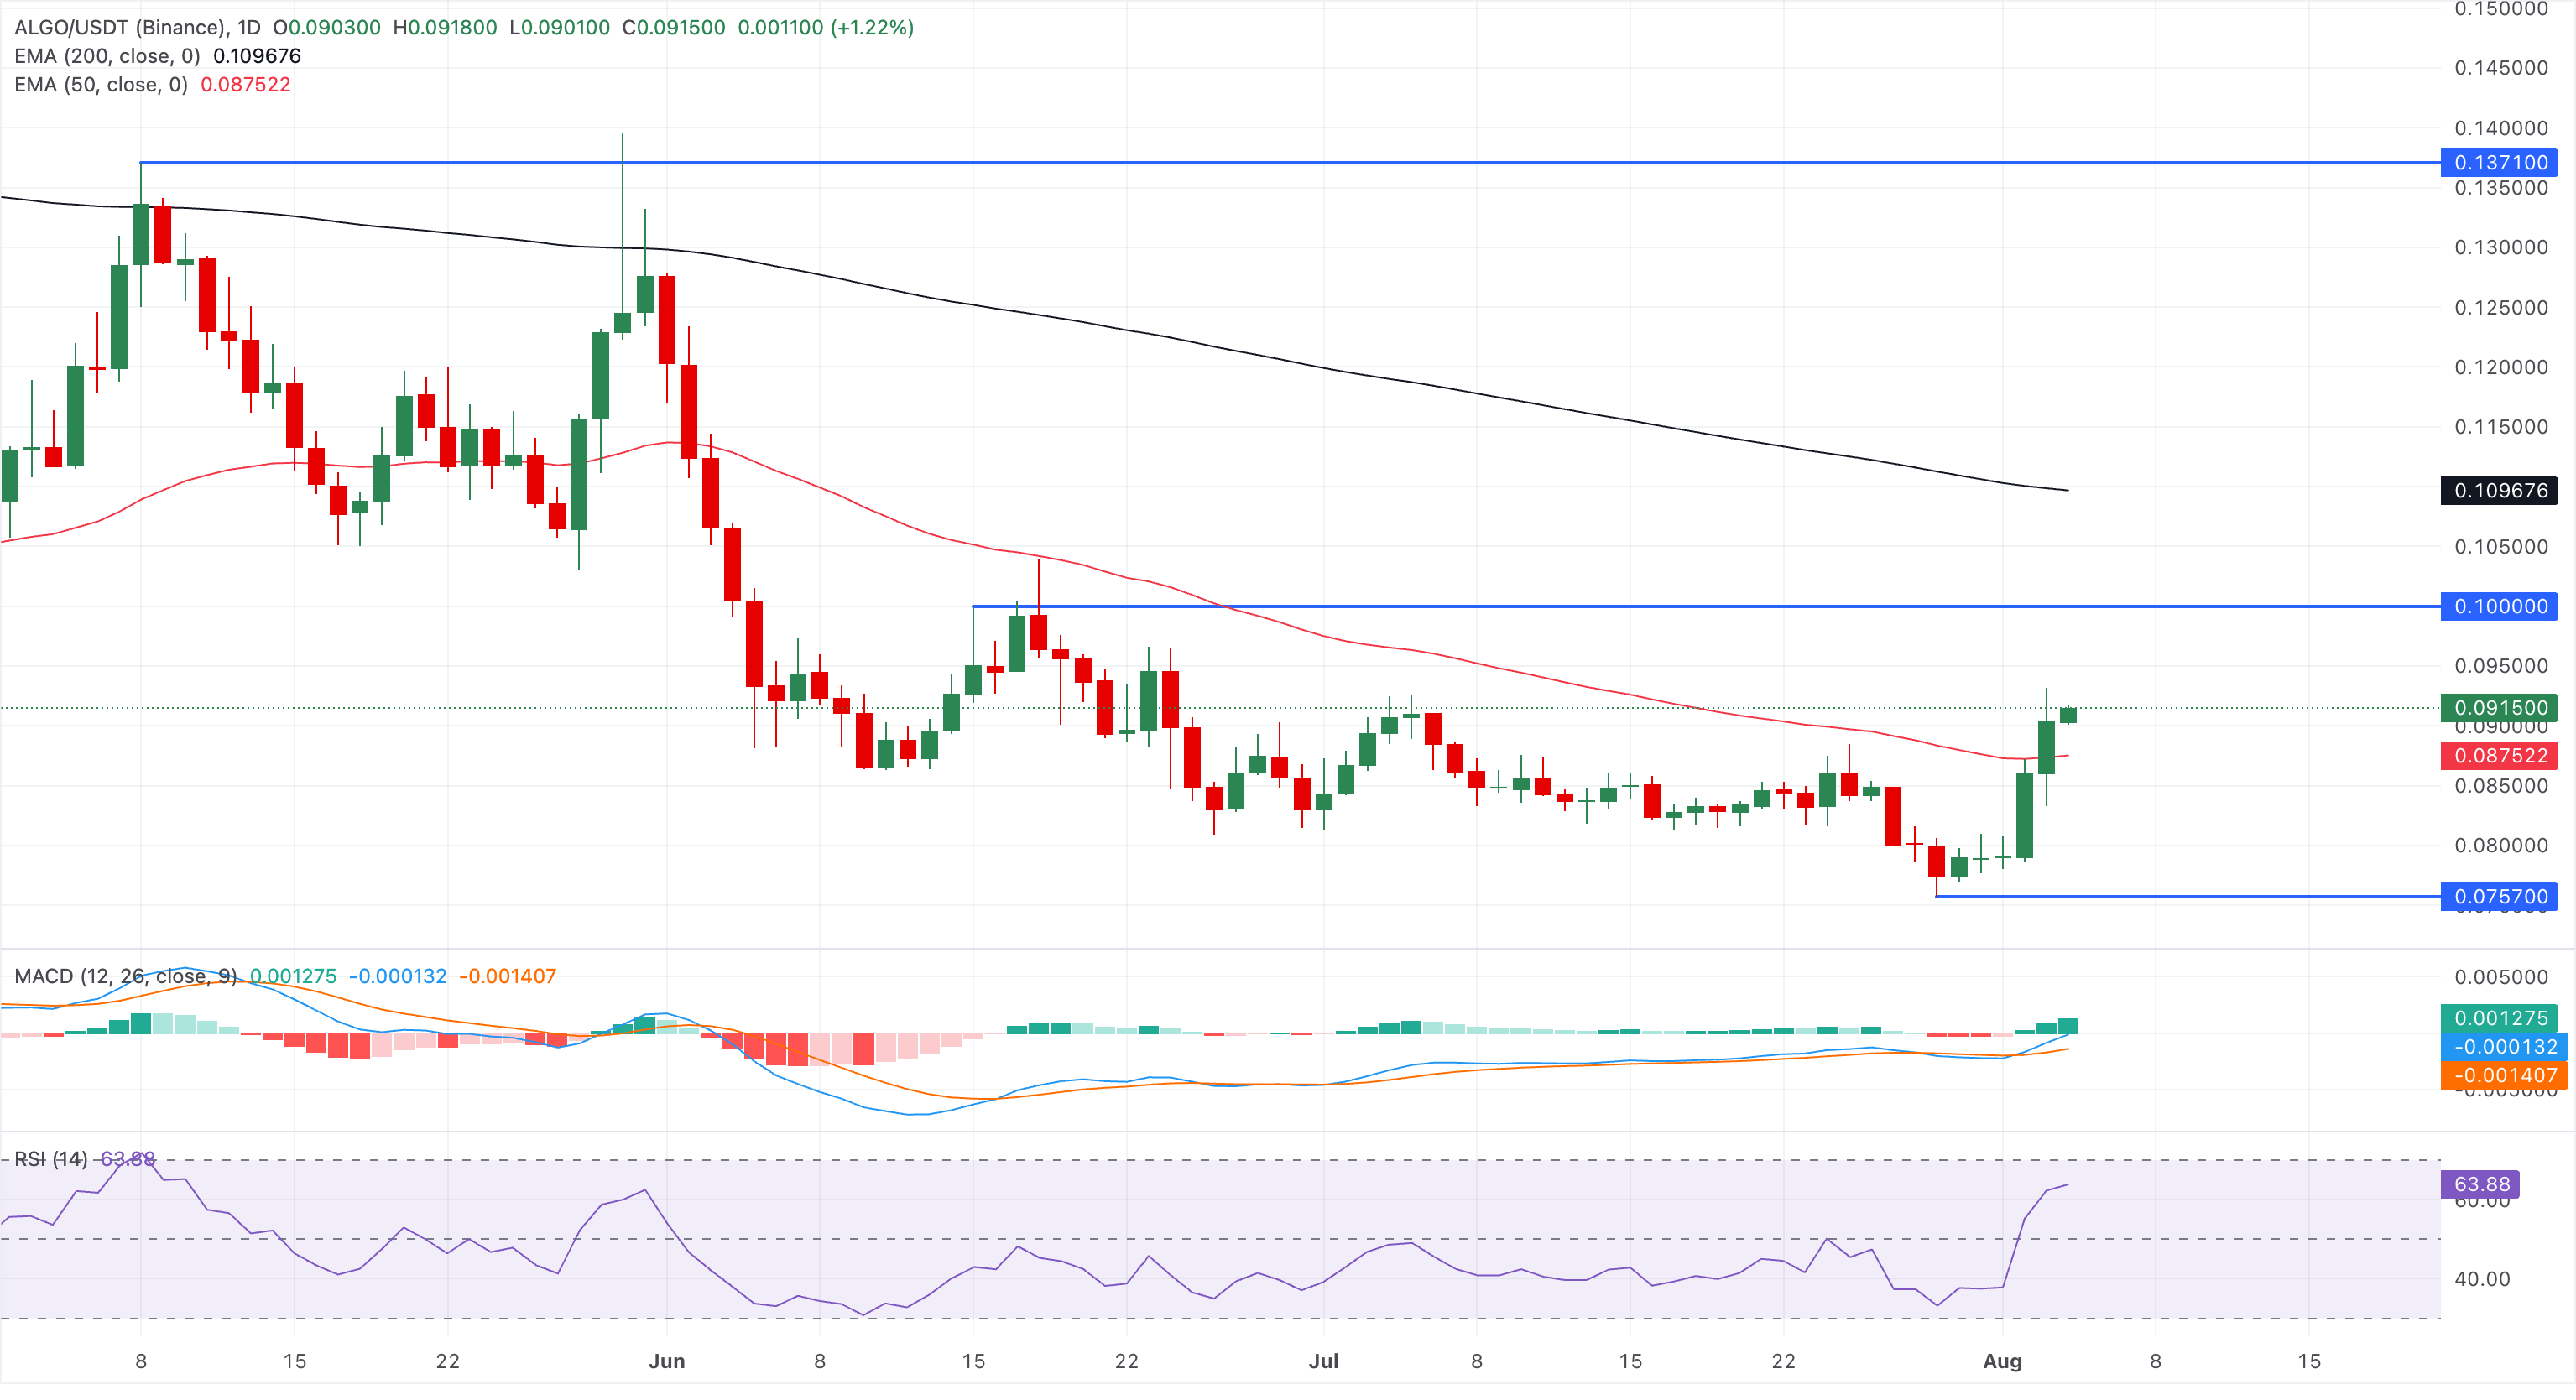
On the downside, the immediate pivot is the 50-period EMA at $0.0875, where a pullback toward it could attract buyers as long as the daily close holds above it.
(The technical analysis of this story was written with the help of an AI tool. Know more.)
Recommended Articles


