


Silver (XAGUSD) Is up 2.09% on Oct 5: What Changed in Supply and Demand?
Silver (XAGUSD) is up 2.09% at Oct 5 03:45(ET), now at $61.552, with a 7-day up of 1.70%.
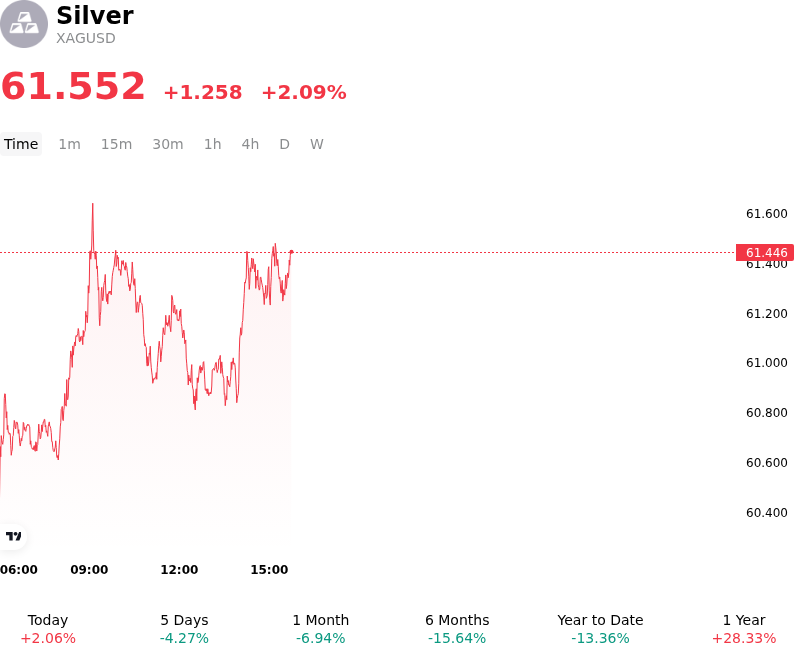
What is driving Silver (XAGUSD)’s stock price up today?
The advance in spot silver reflects a repricing of Federal Reserve monetary policy expectations following softer-than-expected US labor market data. A marked deceleration in monthly nonfarm payroll growth and a slight uptick in unemployment weakened the case for near-term monetary tightening, prompting financial markets to scale back odds of further benchmark interest rate increases. This downward adjustment in terminal rate expectations pulled US Treasury yields off recent highs and softened the US dollar, reducing the opportunity cost of holding non-yielding precious metals and triggering institutional capital inflows into the complex.
Compounding the macroeconomic tailwinds, heightened geopolitical friction in the Middle East provided additional safe-haven support. Escalating regional conflicts and heightened threats to key maritime trade routes renewed geopolitical risk premiums, driving asset allocators toward hard assets as a hedge against potential supply-chain disruptions and energy market instability.
From a market structure perspective, silver's upward movement was further propelled by short-covering activity and momentum-driven institutional positioning after spot prices successfully defended technical support levels. While silver remains exposed to underlying fluctuations in global industrial demand, the immediate pricing dynamic is being dictated by a macro regime shift characterized by easing yield pressure, a subdued dollar, and elevated systemic risk.
Technical Analysis of Silver (XAGUSD)
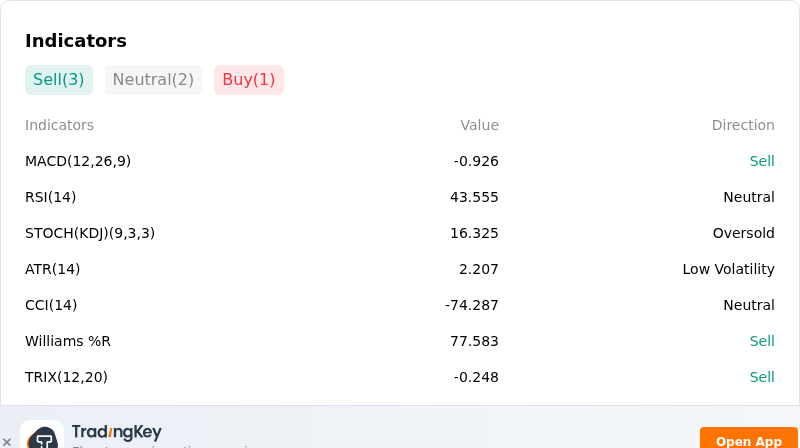
Technically, Silver (XAGUSD) shows a MACD (12,26,9) value of -0.926, indicating a sell signal. The RSI at 43.555 suggests neutral condition and the Williams %R at 77.583 suggests sell condition. Please monitor closely.
More details about Silver (XAGUSD)
Recent Events and Risks:
- Elevated Treasury Yields and Hawkish Fed Expectations: A surge in U.S. Treasury yields and persistent strength in the U.S. dollar, backed by resilient economic data and expectations of prolonged restrictive monetary policy, are driving capital away from non-yielding assets, placing heavy downside pressure on spot silver.
- Photovoltaic Demand Softening and Thrifting: Industrial demand for silver faces ongoing structural headwinds from the solar sector as manufacturers accelerate silver-thrifting processes and alternative metal substitution in solar panel manufacturing, curbing overall consumption growth.
- Trade Import Tariffs and Licensing Friction: Elevated import duties in major physical buying hubs alongside restricted export licensing regimes are distorting physical arbitrage windows and liquidity, dampening international trade flows and creating downside market volatility.
- Speculative Unwinding and Technical Support Breakdown: Recent breaks below critical technical support levels near $60 per ounce, coupled with a contraction in net-long futures positioning by money managers, heighten the risk of stop-loss liquidation and forced selling across derivative markets.
Recommended Articles


