

Litecoin Price Forecast: LTC sellers tighten grip, eyeing a move below $40

Source Fxstreet
  • Litecoin trades below $43 on Wednesday after a massive correction in the previous week.
  • Derivatives metrics back a bearish outlook with declining open interest and rising short bets.
  • The technical outlook suggests sellers are in control, aiming for levels below $40.

Litecoin (LTC) remains under pressure, trading below $43 on Wednesday after suffering a steep correction last week. Bearish sentiment continues to build as derivatives metrics signal reduced bullish conviction. In addition, a weakening technical outlook suggests LTC could face further downside below the $40 mark.

Derivatives metrics show bearish bias

Litecoin’s derivatives data shows a bearish bias. CoinGlass’ Open Interest (OI) for LTC drops to $283 million on Wednesday from the May high of $411 million, reaching levels not seen since November 2024. This steady drop in OI reflects waning investor participation and projects a bearish outlook.
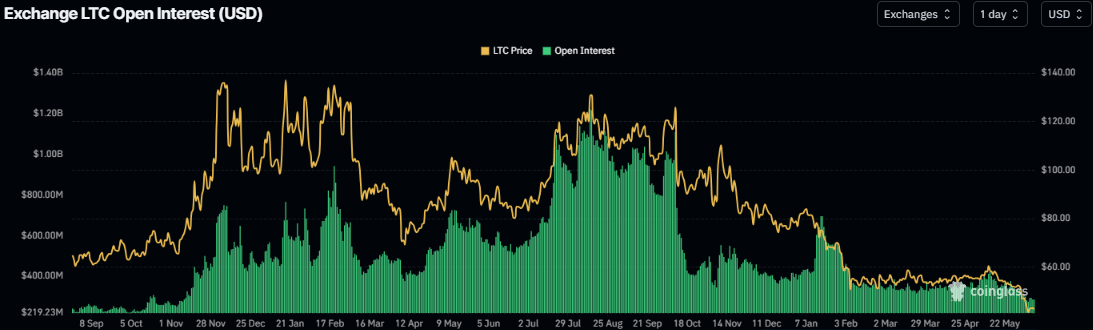
Litecoin open interest chart. Source: Coinglass

In addition, Coinglass’s long-to-short ratio for Litecoin reads 0.88 on Wednesday, nearing the lowest level over a month. The ratio being below one, indicates bearish sentiment, as traders are betting the asset’s price will fall.
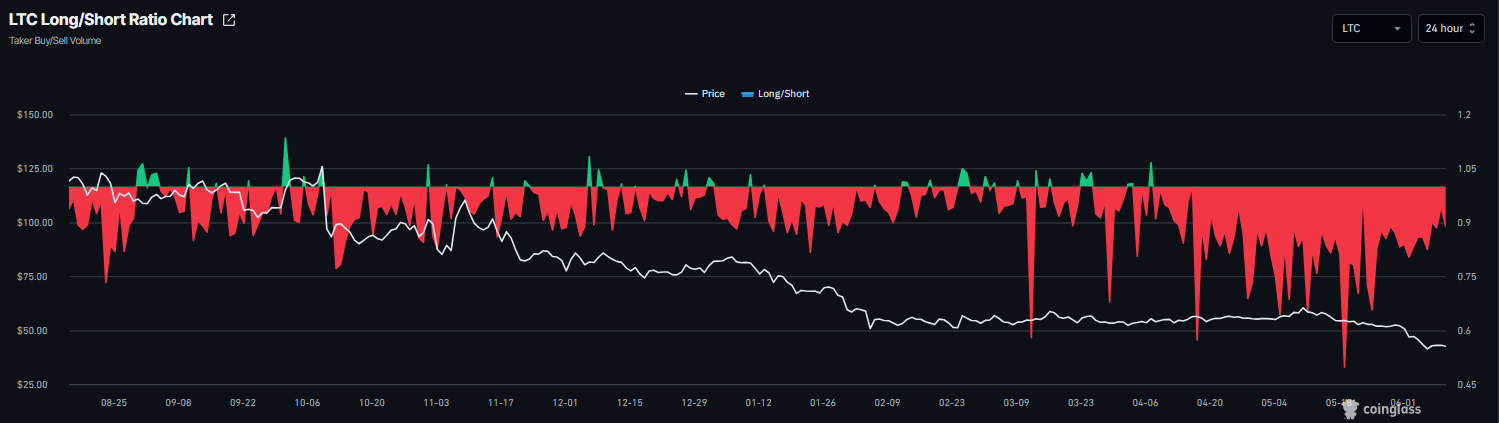
LTC long-to-short ratio chart. Source: Coinglass

Litecoin Price Forecast: Bears aiming for lower lows

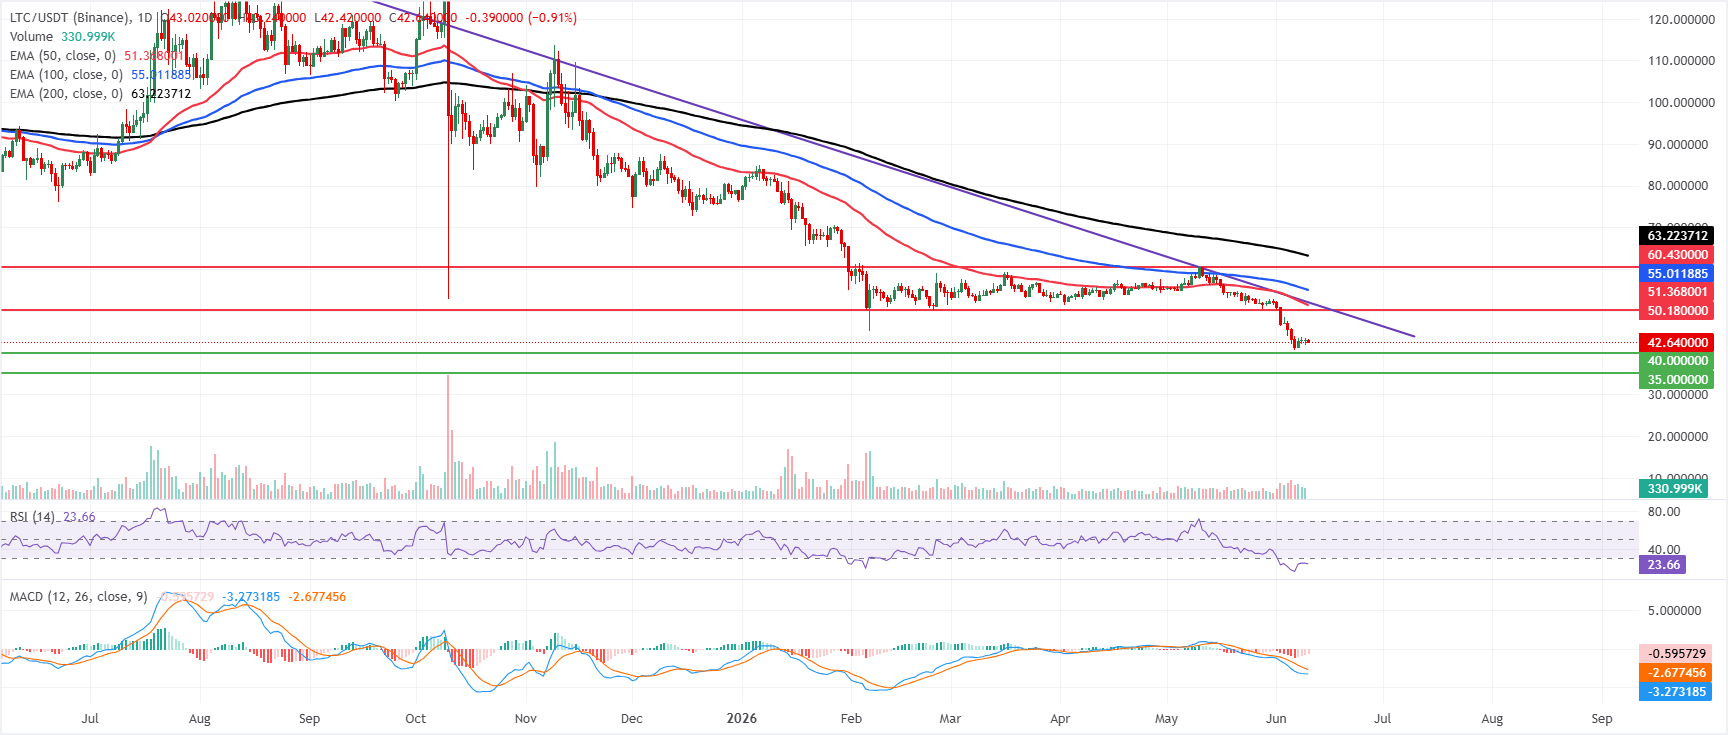
Litecoin price trades at $42.54 on Wednesday, retaining a bearish near-term bias as it holds well below the 50-day, 100-day, and 200-day Exponential Moving Averages (EMAs) at $51.36, $55.01, and $63.22, respectively. The long-standing descending trendline, now projecting resistance around the prior break near $51.99, reinforces the idea that rallies are capped. At the same time, the Relative Strength Index (RSI) on the daily chart at 23 sits in oversold territory. The Moving Average Convergence Divergence (MACD) remains negative, hinting that downside pressure persists despite stretched conditions.

On the topside, initial resistance is at the horizontal barrier of $50.18, followed closely by the 50-day EMA at $51.36 and the nearby trendline resistance at $51.99. The 100-day EMA at $55.01 and the $60.43 and $63.22 levels form successive caps should a stronger rebound unfold. 

On the downside, immediate support emerges at the $40.00 horizontal level, ahead of a deeper floor near $35.00, where buyers would be expected to show more interest if the current decline extends.
(The technical analysis of this story was written with the help of an AI tool.)

Disclaimer: For information purposes only. Past performance is not indicative of future results.
placeholder
Cardano Tumbles 10% in Deepening Crypto Rout to Post Worst Day Since FebruaryCardano shed 10% on Thursday to hit $0.1925, marking its worst daily performance since Feb. 5 as a broader digital asset selloff dragged down Bitcoin and Ethereum.
Author  Mitrade Team
6 Month 04 Day Thu
Cardano shed 10% on Thursday to hit $0.1925, marking its worst daily performance since Feb. 5 as a broader digital asset selloff dragged down Bitcoin and Ethereum.
placeholder
Will the Tech Rally Continue? The Technical Verdict on the NASDAQ 100 Riding a massive 32% post-earnings wave, the Nasdaq-100 is showing its first signs of exhaustion. We break down crucial exit and entry rules for long positions this week.
Author  Mitrade Team
6 Month 05 Day Fri
Riding a massive 32% post-earnings wave, the Nasdaq-100 is showing its first signs of exhaustion. We break down crucial exit and entry rules for long positions this week.
placeholder
Markets on a Wire: Imminent US Inflation Data Threatens to Lock In Fed Rate Hikes Imminent CPI and PPI data threaten to lock in a hawkish Federal Reserve rate hike cycle, leaving gold, tech equities, and Bitcoin highly vulnerable to a programmatic sell-off.
Author  Mitrade Team
6 Month 09 Day Tue
Imminent CPI and PPI data threaten to lock in a hawkish Federal Reserve rate hike cycle, leaving gold, tech equities, and Bitcoin highly vulnerable to a programmatic sell-off.
placeholder
XRP Price Prediction for July 2026: Can Buyers Finally Break the Downtrend?XRP (XRP) price trades near $1.05, caught between a year-long downtrend and a sudden burst of buying.July has historically rewarded XRP holders. This year the month arrives with on-chain accumulation
Author  Beincrypto
6 Month 30 Day Tue
XRP (XRP) price trades near $1.05, caught between a year-long downtrend and a sudden burst of buying.July has historically rewarded XRP holders. This year the month arrives with on-chain accumulation
placeholder
What to Expect From Ethereum (ETH) in July 2026Ethereum (ETH) enters July 2026 trading near $1,570, close to multi-month lows, after recording its first run of three consecutive red quarterly candles in its history.On-chain data and price charts n
Author  Beincrypto
7 Month 01 Day Wed
Ethereum (ETH) enters July 2026 trading near $1,570, close to multi-month lows, after recording its first run of three consecutive red quarterly candles in its history.On-chain data and price charts n
Related Instrument
goTop
quote