


Ethereum Price Prediction: As Ethereum Tops $2,500, Can It Reclaim $3,000 in the Short Term?
TradingKey - As of the Asian session on August 27, Ethereum (ETH) maintained high-level consolidation following a strong rebound, with the latest price trading around $2,500. Earlier on August 21, Ethereum surged sharply, briefly reaching $2,546.78 to hit a new high since February this year. Since August, Ethereum's rebound has exceeded 30%, but recent consolidation around $2,500 indicates that short-term divergence between bulls and bears is growing.
Ethereum ETF Inflows Continue as Staking Reduces Market Circulating Supply
From a fundamental perspective, the main factor supporting the recent rise in Ethereum prices is the continuous inflow of institutional capital back into Ethereum ETFs.
Data shows that for the week ending August 21, US spot Ethereum ETFs recorded a cumulative net inflow of approximately $697 million, marking the largest single-week inflow since 2026. During the same period, Bitcoin and Ethereum ETFs combined attracted about $2.6 billion in capital, making it the best-performing week since October 2025.
The latest capital flows remain strong. According to SoSoValue data, US spot Ethereum ETFs saw a net inflow of approximately $192 million on August 26, marking the eighth consecutive trading day of net inflows. Among them, BlackRock's ETHA recorded a single-day net inflow of about $116 million. As of that day, the total net asset value of spot Ethereum ETFs reached approximately $15.13 billion, with a cumulative net inflow of about $12.64 billion.
Sustained ETF capital inflows indicate that the market rally, previously driven mainly by short covering, is now gaining support from more stable spot buying. Notably, net inflows into US spot Ethereum ETFs have reached approximately $1.06 billion since August, significantly higher than July's roughly $365 million, signaling a clear acceleration in institutional capital allocation to ETH.
Meanwhile, a rapid increase in staking demand is also supporting the continued rise in Ethereum prices. On August 17, the amount of ETH in the Ethereum staking entry queue reached approximately 2.23 million. Based on the network processing speed at the time, new stakers needed to wait about 39 days to officially become validators, while the exit queue contained only 64 ETH. Active staked balances reached approximately 42.24 million ETH.
The data shows that a large amount of ETH is locked in the staking system. Coupled with continuous purchases by ETFs and corporate capital, the freely circulating supply of ETH on exchanges may decline further. If institutional demand continues to increase, this supply tightening will help amplify upside price elasticity, thereby supporting further gains in Ethereum prices.
It is worth noting that some ETFs themselves are also incorporating staking. BlackRock's iShares Staked Ethereum Trust ETF (ETHB) already offers staking yields, with a 30-day staking reward rate of approximately 1.75% reported as of August 20. 21Shares also renamed its Ethereum ETF to Ethereum Staking ETF this week.
Ethereum Price Technical Analysis
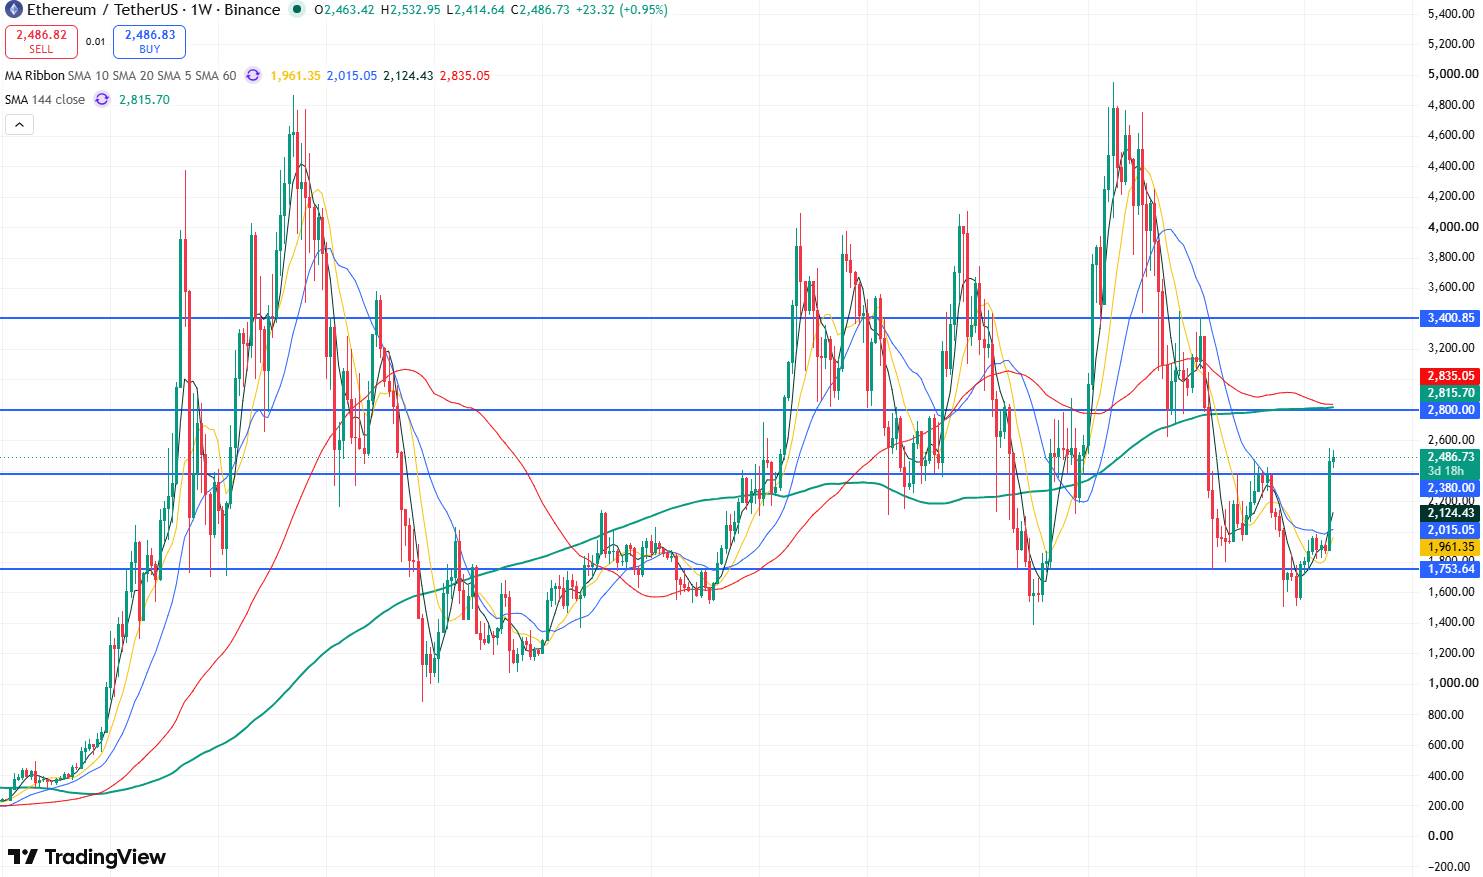
Ethereum price weekly chart, Source: TradingView
Looking at Ethereum's weekly price chart, Ethereum rebounded strongly by 31.31% last week from around $1,870, briefly breaching the $2,000, $2,400, and $2,500 levels, indicating an improvement in the short-term bullish structure. As Ethereum's price broke through April's rebound high of $2,464.91, market bullish momentum was further strengthened.
Currently, Ethereum has been consolidating below $2,550 for several recent trading days, indicating strong resistance at this level. If Ethereum can effectively break out and hold above this level, it will open up upside room toward the $2,800 resistance level. A further breakthrough above $2,800 could see Ethereum testing $3,000 to the upside, with the potential to rally toward the $3,400 resistance level.
On the downside, the primary support level to watch for Ethereum is around $2,470. If this level fails to hold, Ethereum may retreat toward around $2,300. Should the decline continue, Ethereum could test the 20-day moving average on the daily chart.
Recommended Articles


