


EUR/GBP Price Forecast: Bulls challenge 0.8600 resistance after weeks of consolidation
- EUR/GBP heads for a weekly gain as the Bank of England’s cautious stance weighs on the British Pound.
- The cross holds a bullish technical setup as RSI and MACD point to positive momentum.
- A sustained move above 0.8600 could confirm a bullish breakout and shift focus toward the 200-day SMA at 0.8639.
EUR/GBP trades flat around 0.8600 on Friday and is heading for a weekly gain as the Bank of England’s (BoE) wait-and-see stance weighs on the British Pound (GBP). The BoE has remained on hold so far this year, leaving its benchmark rate unchanged at 3.75% at last week’s meeting. This has left the BoE lagging behind the Federal Reserve and European Central Bank (ECB) in raising interest rates.
BoE Governor Andrew Bailey reiterated on Friday that “there has been a tightening of financial conditions.” He added that the UK is seeing “quite subdued pass-through of energy prices.” However, Bailey warned that “the longer we go on with high energy prices, the harder it gets to maintain no hike in the Bank Rate stance.”
Strategists at Brown Brothers Harriman highlight a growing disconnect between market pricing and their assessment of the UK policy outlook. They note that “the swaps curve continues to imply about 100bps of BoE rate hikes in the next twelve months to 4.75%,” but argue that “the BoE may not need to tighten as much as markets expect.” In their view, “the UK economy is already operating below capacity, the Bank Rate at 3.75% is near the top of the BoE’s estimated 2% to 4% neutral range, and fiscal policy will likely turn more restrictive,” all of which point to a lower-for-longer policy path than current market assumptions.
The ECB has already raised interest rates twice this year, while markets are pricing in additional tightening. Against this backdrop, the outlook for EUR/GBP remains tilted to the upside, with technical indicators also pointing to a bullish bias.
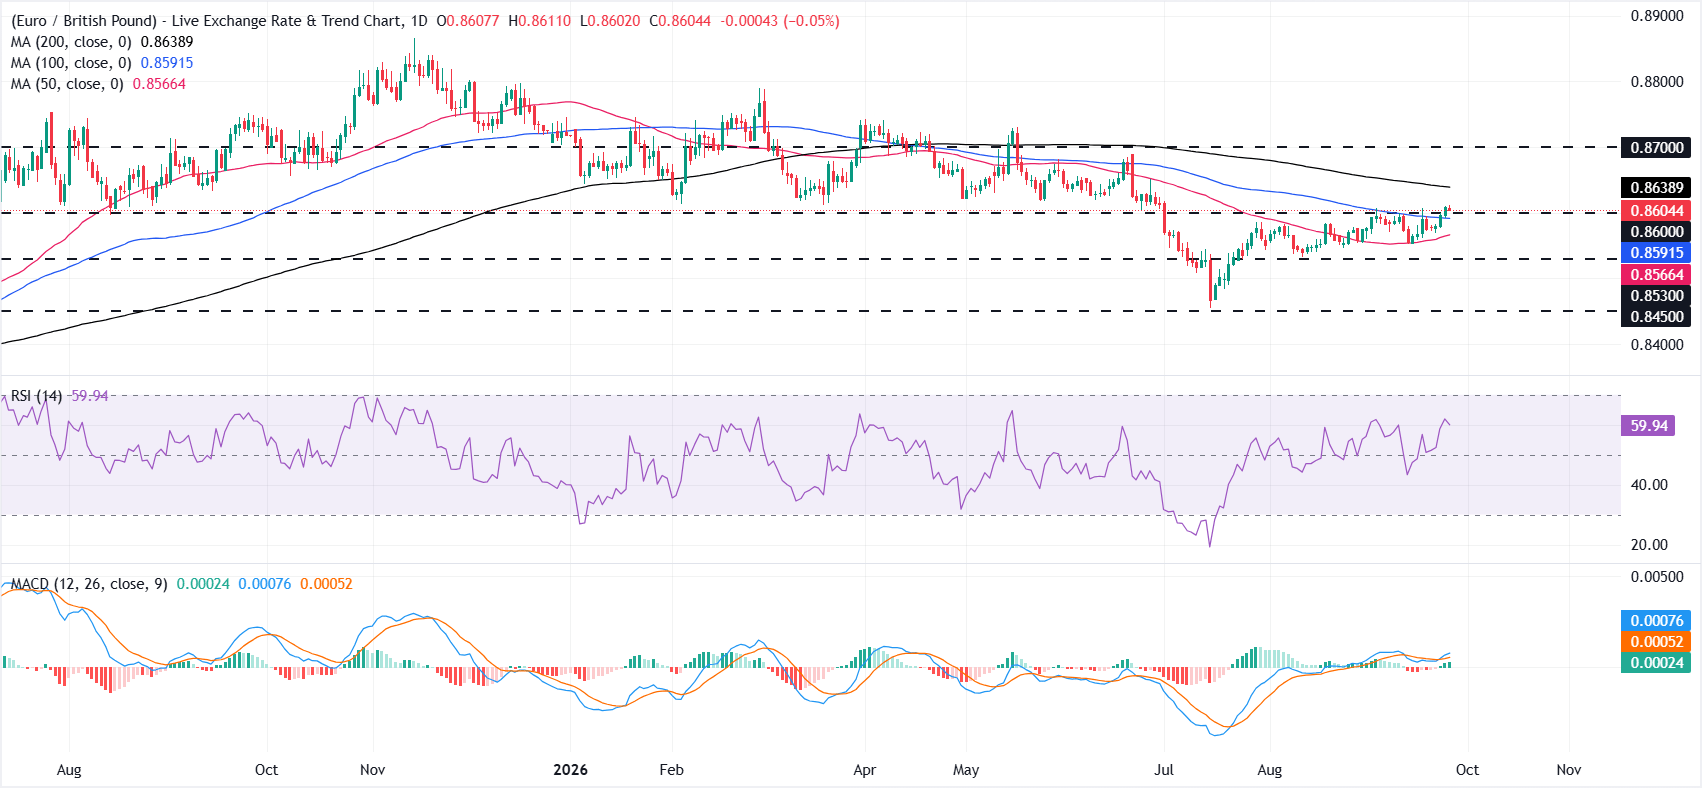
On the daily chart, EUR/GBP is testing the key 0.8600 zone after consolidating several weeks below it following a rebound from below 0.8500 in mid-July.
The 0.8600 level previously acted as multi-month support and has now turned into resistance. A decisive close above would strengthen the bullish outlook and expose the 200-day Simple Moving Average (SMA) at 0.8639, followed by the 0.8700 barrier.
An RSI (14) reading near 60 suggests positive but not overextended momentum, and the Moving Average Convergence Divergence (MACD) indicator remains slightly positive, hinting that dips could attract buying interest as long as price stays above the short- and medium-term averages.
On the downside, initial support is seen at the 100-day SMA at 0.8592, followed by the 50-day SMA at 0.8566. A break below this area could expose deeper support at 0.8530 and 0.8450.
Pound Sterling Price This week
The table below shows the percentage change of British Pound (GBP) against listed major currencies this week. British Pound was the strongest against the Australian Dollar.
| USD | EUR | GBP | JPY | CAD | AUD | NZD | CHF | |
|---|---|---|---|---|---|---|---|---|
| USD | 0.73% | 1.04% | 0.54% | 1.05% | 1.21% | 0.94% | 0.71% | |
| EUR | -0.73% | 0.33% | -0.18% | 0.32% | 0.47% | 0.21% | -0.02% | |
| GBP | -1.04% | -0.33% | -0.61% | -0.01% | 0.14% | -0.12% | -0.34% | |
| JPY | -0.54% | 0.18% | 0.61% | 0.56% | 0.66% | 0.41% | 0.19% | |
| CAD | -1.05% | -0.32% | 0.00% | -0.56% | 0.21% | -0.14% | -0.33% | |
| AUD | -1.21% | -0.47% | -0.14% | -0.66% | -0.21% | -0.26% | -0.55% | |
| NZD | -0.94% | -0.21% | 0.12% | -0.41% | 0.14% | 0.26% | -0.22% | |
| CHF | -0.71% | 0.02% | 0.34% | -0.19% | 0.33% | 0.55% | 0.22% |
The heat map shows percentage changes of major currencies against each other. The base currency is picked from the left column, while the quote currency is picked from the top row. For example, if you pick the British Pound from the left column and move along the horizontal line to the US Dollar, the percentage change displayed in the box will represent GBP (base)/USD (quote).
Recommended Articles


