


US Treasury yields rise as 30-Year yield hits 22-year high
- Thirty-year yield touches 22-year high as long-end pressure builds.
- Fed hawks lift year-end tightening odds after September rate increase.
- Rising inflation expectations keep 10-year yield anchored near 5.20%.
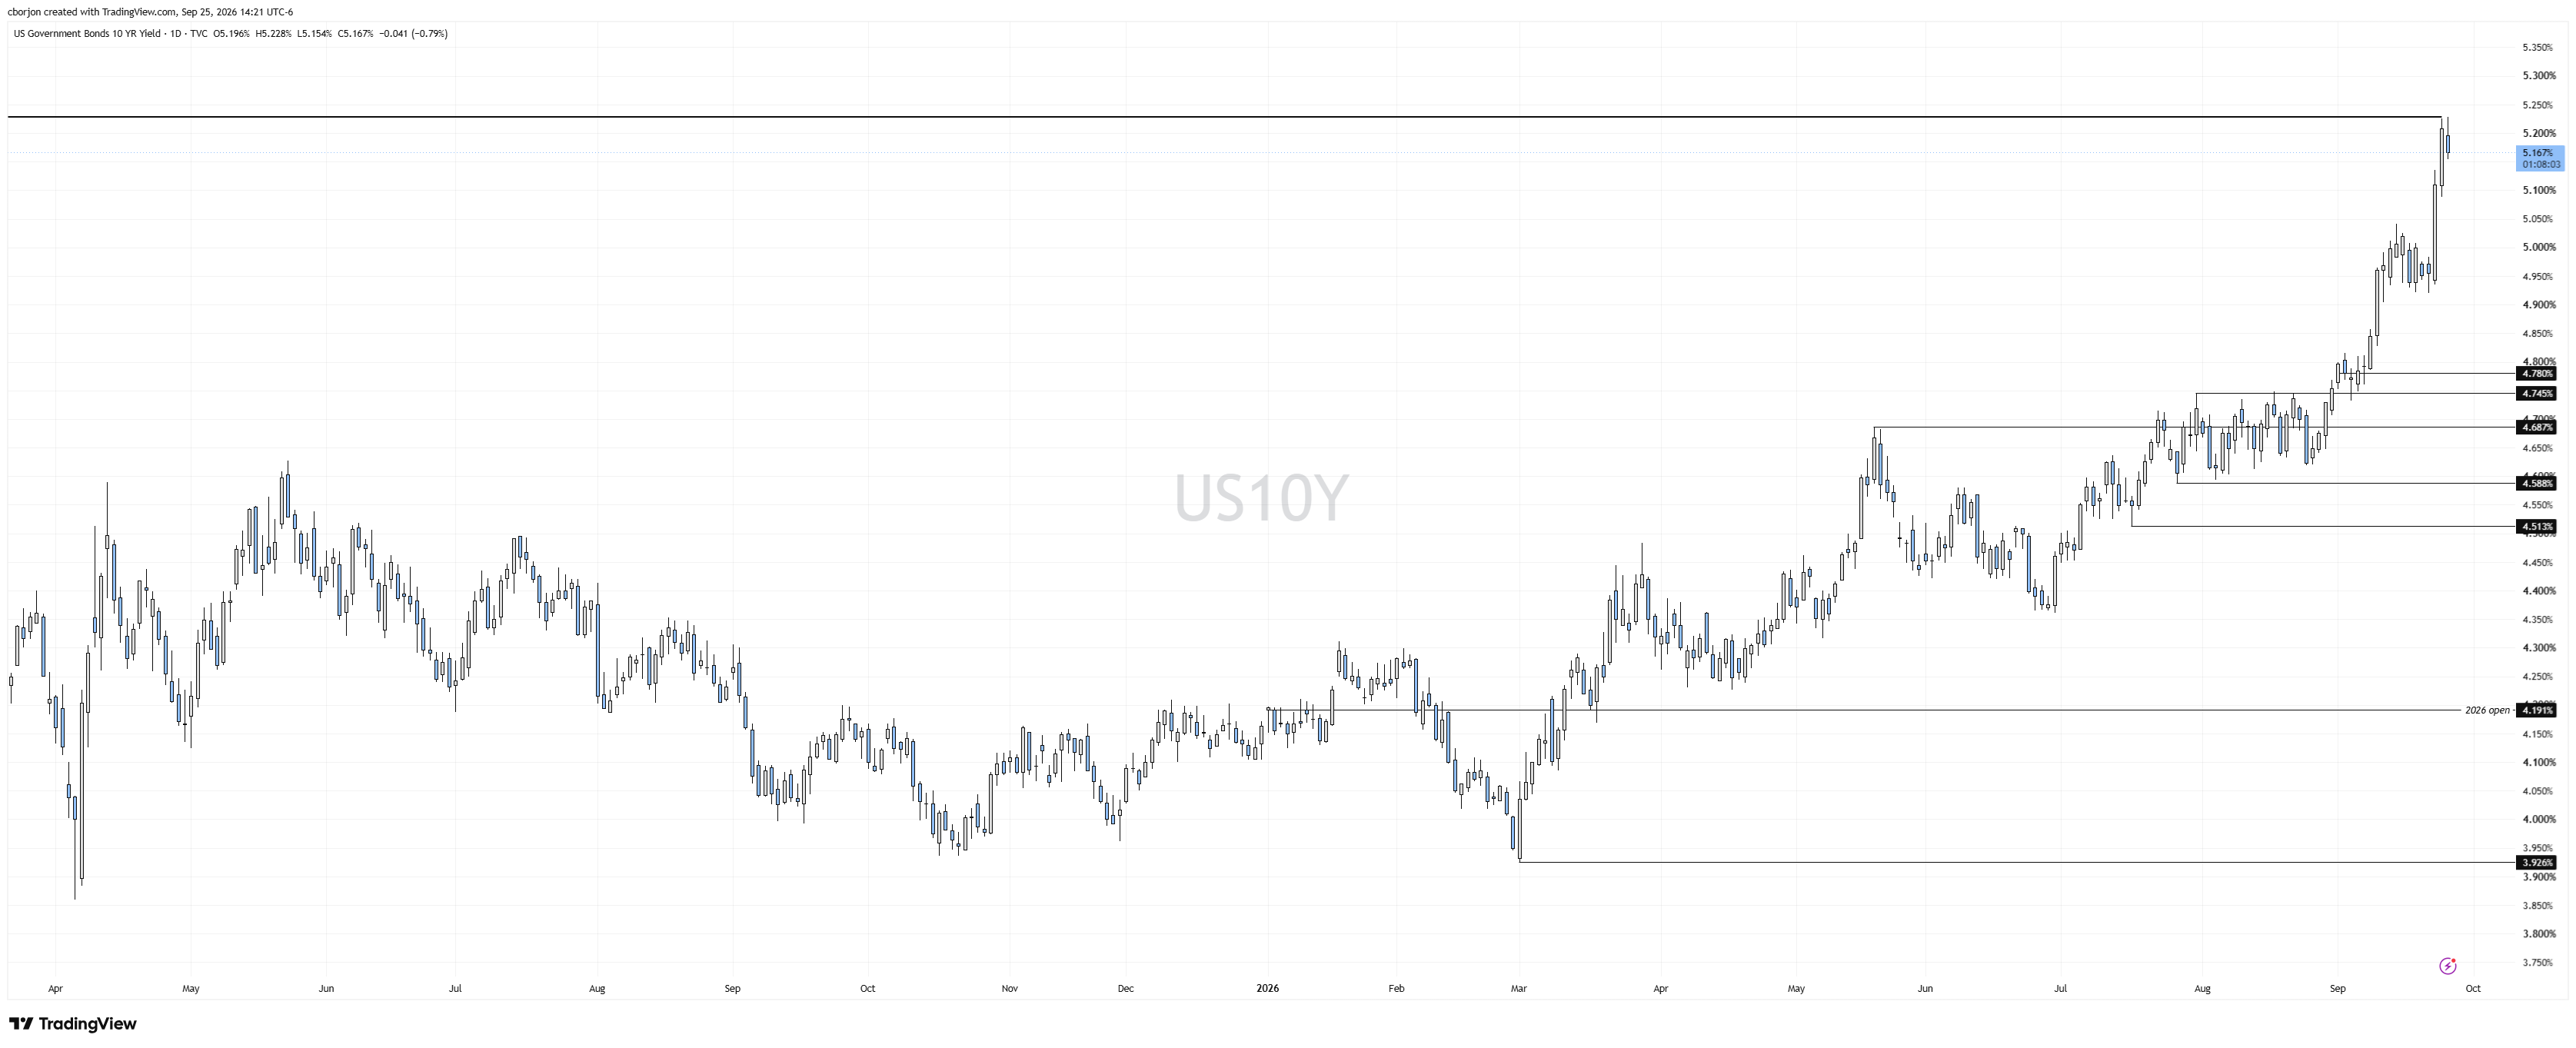
US Treasury yields turned mixed on Friday as the long-end of the curve, the 20s and 30s, posted gains while the short-end and the belly of the yield curve retreated to multi-year high levels. The US 10-year Treasury yield holds firm at 5.20% after peaking at a 19-year high of 5.228%.
Long-end yields climb while Fed tightening bets keep 10-year near 5.20%
During the session, the 30-year bond yield rose to its highest level in 22 years. Hawkish commentary from Federal Reserve officials and last week's 25-basis-point rate hike were the two main catalysts that pushed US Treasury yields higher during the week.
The sudden shift from known doves, New York Fed John Williams (voter) and Philadelphia Fed Anna Paulson (voter in 2026), had increased the hawkish tilt in the FOMC board. Also, Fed Governor Michael Barr, acknowledging the need for further rate hikes on Wednesday, has almost cemented the case for a 25-basis-point rate hike towards the end of the year.
Money markets see a 64% chance of a Fed rate hike in the October 28 meeting, according to Prime Terminal. For the December meeting, the chances are higher at 92%.
Worldwide yields remain underpinned by high Oil prices as the US-Iran war continues to prolong, keeping inflationary pressures elevated.
Data-wise, US Consumer Sentiment deteriorated, with households seeing a leg up on inflation for one year from 4% to 4.6% and for a five-year period from 3.3% to 3.4%. Earlier, core capital goods increased 1.6% in August, boosted by the investment boom in AI.
The yield on the 30-year bond was last unchanged at 5.488%, after peaking at 5.5016%, the highest level since June 2004.
US 10-year Treasury yield chart
Interest rates FAQs
Interest rates are charged by financial institutions on loans to borrowers and are paid as interest to savers and depositors. They are influenced by base lending rates, which are set by central banks in response to changes in the economy. Central banks normally have a mandate to ensure price stability, which in most cases means targeting a core inflation rate of around 2%. If inflation falls below target the central bank may cut base lending rates, with a view to stimulating lending and boosting the economy. If inflation rises substantially above 2% it normally results in the central bank raising base lending rates in an attempt to lower inflation.
Higher interest rates generally help strengthen a country’s currency as they make it a more attractive place for global investors to park their money.
Higher interest rates overall weigh on the price of Gold because they increase the opportunity cost of holding Gold instead of investing in an interest-bearing asset or placing cash in the bank. If interest rates are high that usually pushes up the price of the US Dollar (USD), and since Gold is priced in Dollars, this has the effect of lowering the price of Gold.
The Fed funds rate is the overnight rate at which US banks lend to each other. It is the oft-quoted headline rate set by the Federal Reserve at its FOMC meetings. It is set as a range, for example 4.75%-5.00%, though the upper limit (in that case 5.00%) is the quoted figure. Market expectations for future Fed funds rate are tracked by the CME FedWatch tool, which shapes how many financial markets behave in anticipation of future Federal Reserve monetary policy decisions.
Recommended Articles


