


GBP/USD Price Forecast: Positions above 1.3550, nine-day EMA support
- GBP/USD may rise toward the seven-month high of 1.3675.
- The 14-day Relative Strength Index near 54 indicates mildly positive momentum.
- The nine-day EMA at 1.3542 acts as an immediate support.
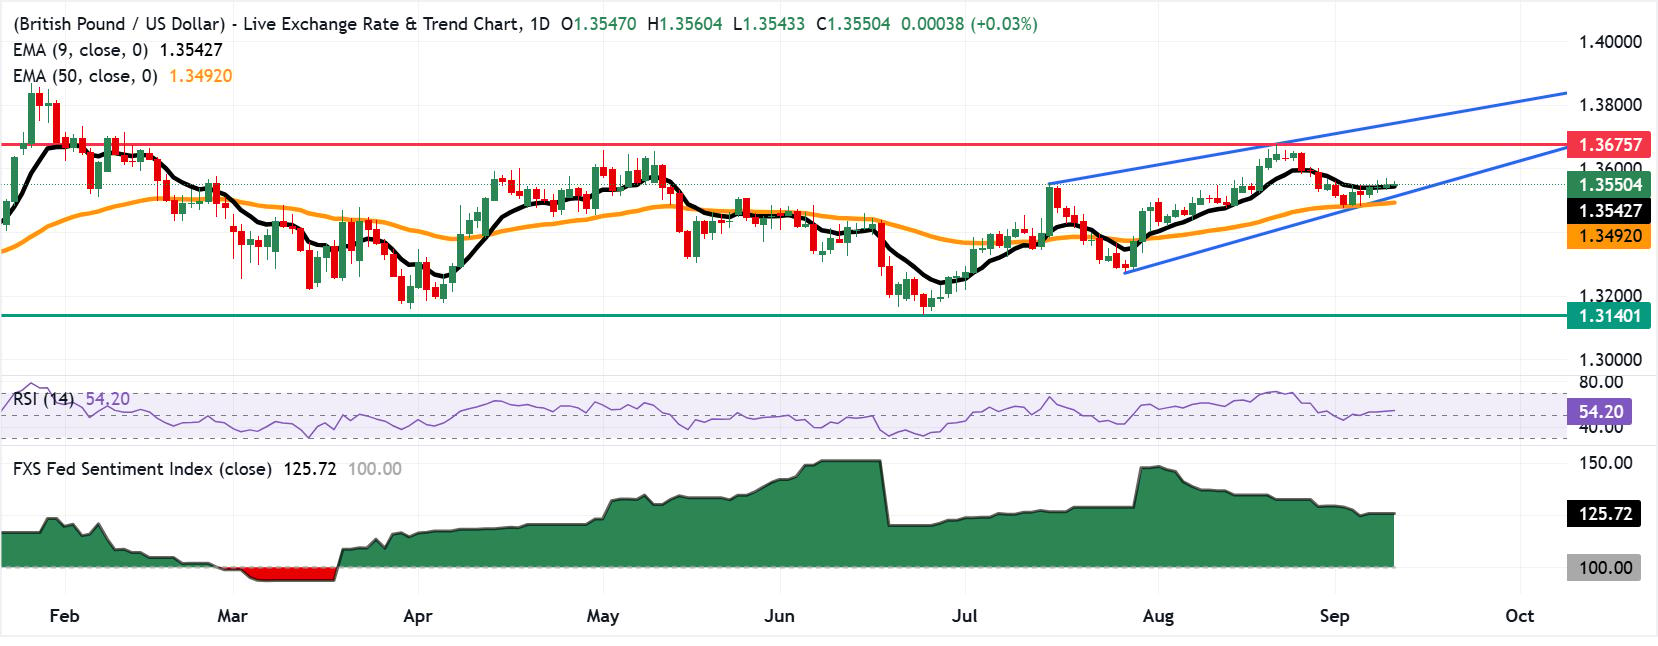
GBP/USD remains stronger for the fourth successive day, trading around 1.3550 during the European hours on Thursday. The pair is maintaining a modest bullish bias as it holds above both the nine- and 50-day Exponential Moving Averages (EMAs). The alignment of short- and medium-term EMAs below price hints at a still constructive trend.
The 14-day Relative Strength Index (RSI) near 54 suggests mildly positive momentum without entering overbought territory, keeping the pair supported on dips rather than overstretched. Moreover, the technical analysis of the daily chart suggests an ongoing bullish bias as the GBP/USD pair is remaining within the ascending channel pattern.
The FXS Fed Sentiment Index is at 125.72, keeping the gauge firmly in hawkish territory well above the neutral 100 line.
The GBP/USD pair may explore the region around the seven-month high of 1.3675, reached on August 21. A break above this level would expose the upper boundary of the ascending channel around 1.3750.
On the downside, the immediate support lies at the nine-day EMA of 1.3542, followed by the lower boundary of the ascending channel around 1.3520 and the 50-day EMA at 1.3492. A sustained break below this confluence support zone would cause a bearish reversal and open the door for the GBP/USD pair to navigate the region around the nine-month low of 1.3140, recorded on June 24.
(The technical analysis of this story was written with the help of an AI tool. Know more.)
Pound Sterling Price Today
The table below shows the percentage change of British Pound (GBP) against listed major currencies today. British Pound was the strongest against the Australian Dollar.
| USD | EUR | GBP | JPY | CAD | AUD | NZD | CHF | |
|---|---|---|---|---|---|---|---|---|
| USD | -0.04% | -0.05% | 0.03% | -0.01% | 0.07% | -0.12% | -0.00% | |
| EUR | 0.04% | -0.01% | 0.05% | 0.02% | 0.11% | -0.09% | 0.03% | |
| GBP | 0.05% | 0.00% | 0.10% | 0.03% | 0.12% | -0.08% | 0.05% | |
| JPY | -0.03% | -0.05% | -0.10% | -0.05% | 0.04% | -0.19% | -0.03% | |
| CAD | 0.00% | -0.02% | -0.03% | 0.05% | 0.09% | -0.12% | 0.02% | |
| AUD | -0.07% | -0.11% | -0.12% | -0.04% | -0.09% | -0.20% | -0.05% | |
| NZD | 0.12% | 0.09% | 0.08% | 0.19% | 0.12% | 0.20% | 0.17% | |
| CHF | 0.00% | -0.03% | -0.05% | 0.03% | -0.02% | 0.05% | -0.17% |
The heat map shows percentage changes of major currencies against each other. The base currency is picked from the left column, while the quote currency is picked from the top row. For example, if you pick the British Pound from the left column and move along the horizontal line to the US Dollar, the percentage change displayed in the box will represent GBP (base)/USD (quote).
Recommended Articles


