


Bond Market Flashes a Rare Warning Signal: What History Says Happens to Stocks Next
Key Points
The 30-year Treasury bond yield recently reached its highest level since 2007, sparking concern about a stock market sell-off.
Long-term investors shouldn’t worry too much about short-term moves in bond yields.
- These 10 stocks could mint the next wave of millionaires ›
The 30-year Treasury bond yield is one of the most important measures of U.S. government borrowing costs, and ultimately the cost of money. And that cost seems to be going up.
The 30-year Treasury yield recently rose above 5.2%. That's a level it hasn't reached since 2007. The last time bond yields reached this high, stock market crashes followed. The highest 30-year Treasury yields this century were in 2000, right before the dot-com crash.
Missed Nvidia in 2009? This Rare Signal Is Flashing Again. In 2009, a "Double Down" signal flashed for a little-known chipmaker called Nvidia. For the first time in years, that same "Total Conviction" signal is flashing for a company 1/100th the size of Nvidia. Continue »
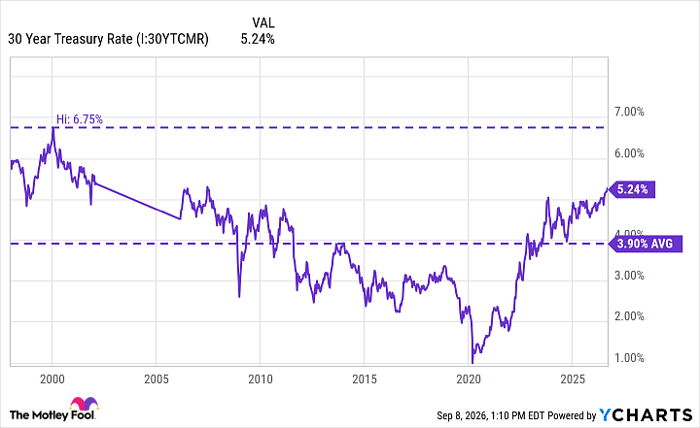
Data by YCharts.
Does this mean the bond market is sending a warning that it's time to sell stocks? Not necessarily. The history of the stock market doesn't repeat itself precisely, and bond yields don't always predict a downturn in stocks.
Let's look at what the latest moves in 30-year Treasury yields might mean for your stock investments -- and why long-term investors shouldn't worry.
Image source: Getty Images.
Why high bond yields are (often) bad for stocks
When bond yields rise, it can sometimes be bad news for stock prices. That's because higher yields on Treasury bonds raise borrowing costs for the government, businesses, and consumers. More expensive money often leads to less money being spent in the economy, less money being used to buy houses and cars, and less money being invested in future business growth. Share prices often decline due to these financial pressures.
Higher yields in fixed-income investments can also lead investors to shift money from stocks to bonds. If you can earn income of 5.2% per year for 30 years with risk-free Treasury bonds, the risks of owning stocks become less appealing for some investors.
What should investors do about high bond yields?
Higher bond yields could be the start of a serious stock market sell-off and a government debt crisis -- or not. High bond yields don't have to be a warning signal. They could be a healthy sign of a fast-growing economy and a bond market that wants to be paid a little better for inflation costs and the long-term risks of lending to the U.S. government.
How should you invest for a future of higher bond yields? Most of the time, long-term investors should just stick with their plan. Keep buying a diversified stock portfolio, such as the Vanguard S&P 500 ETF (NYSEMKT: VOO). Even if bond yields tick up a bit higher in the next few years, this exchange-traded fund (ETF) might be fine. It has delivered average annual returns of 15% over the past 16 years, including amid the big run-up in bond yields over the past six years.
If you want to add more bonds to your portfolio, the Vanguard Total Bond Market ETF (NASDAQ: BND) is an easy, low-cost way to own thousands of government bonds and corporate bonds. It ranks as one of the best bond ETFs and can be a great choice for long-term investors. As of this writing, this bond ETF is paying a 30-day SEC yield of 4.71%.
Whatever you do next with your investments, try not to overreact. Bond yields can go down as well as up. A 1% to 5% decrease in S&P 500 index share prices is not a reason to panic, and neither are slight increases in bond yields. Instead of a warning sign, this could be just a sign that the bond market is working as it should. Stocks don't have to crash because of it. No matter what happens next with bond yields, your stock investments can keep growing for the long term.
Where to invest $1,000 right now
When our analyst team has a stock tip, it can pay to listen. After all, Stock Advisor’s total average return is 960%* — a market-crushing outperformance compared to 213% for the S&P 500.
They just revealed what they believe are the 10 best stocks for investors to buy right now, available when you join Stock Advisor.
See the stocks »
*Stock Advisor returns as of September 10, 2026.
Ben Gran has positions in Vanguard Total Bond Market ETF. The Motley Fool has positions in and recommends Vanguard S&P 500 ETF and Vanguard Total Bond Market ETF. The Motley Fool has a disclosure policy.
Recommended Articles


