


Copper (COPPER) Is down by 2.15% on Sep 10: Is the Demand Outlook Changing?
Copper (COPPER) is down 2.15% at Sep 10 06:30(ET), now at $14496.3, with a 7-day up of 0.97%.
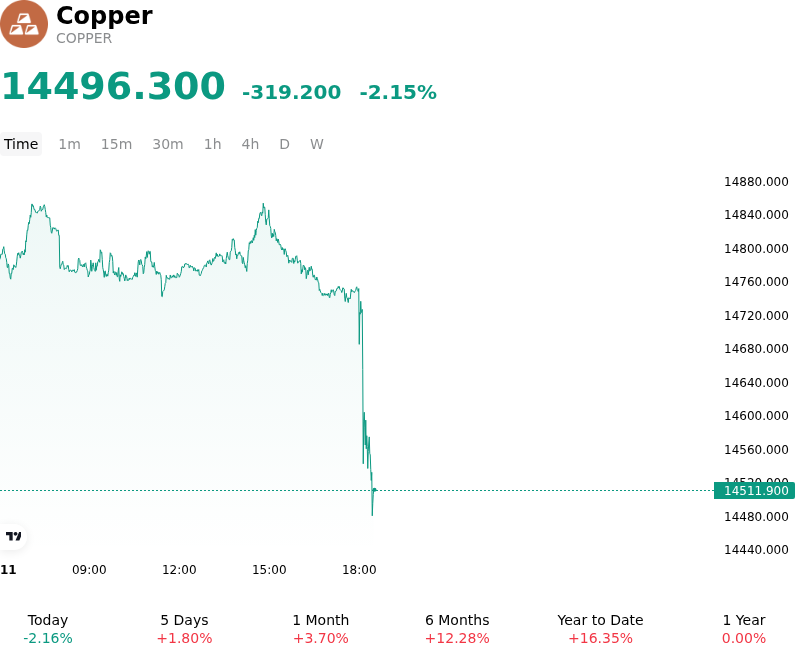
What is driving Copper (COPPER)’s stock price down today?
The retreat in copper prices was primarily driven by aggressive profit-taking following a multi-session surge to record highs, combined with growing resistance from downstream consumers facing prohibitive spot metal costs. After reaching historic price peaks driven by lingering mine supply deficits and trade distortions stemming from potential US import tariffs, the market encountered a fundamental repricing as physical buyers scaled back spot purchases.
Physical market signals reflected a widening disconnect between speculative momentum and real-economy consumption, particularly in China where refined copper imports softened and end-use fabricators delayed orders in response to elevated prices. Concurrently, a modest recovery in London Metal Exchange warehouse stocks helped ease prompt tightness outside the US, tempering the severe backwardation that had previously characterized the forward curve.
Macroeconomic headwinds further weighed on sentiment as renewed hawkish central-bank rate expectations and a firming US dollar increased holding costs for dollar-denominated base metals. Institutional capital flows turned defensive as funds trimmed overextended long positions, while market participants continued to evaluate potential risks around South American mine output, global smelter utilization rates, and the sustainability of industrial demand.
Technical Analysis of Copper (COPPER)
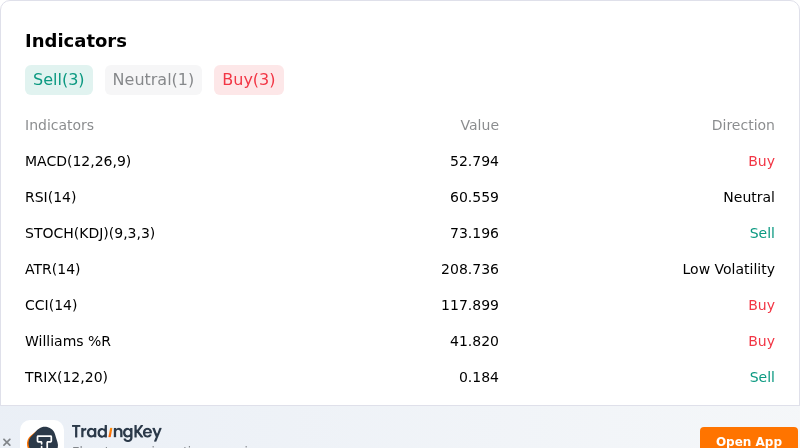
Technically, Copper (COPPER) shows a MACD (12,26,9) value of 52.794, indicating a buy signal. The RSI at 60.559 suggests neutral condition and the Williams %R at 41.820 suggests buy condition. Please monitor closely.
More details about Copper (COPPER)
Recent Events and Risks:
- Chinese Demand Deterioration and Import Slump: Chinese unwrought copper imports fell to 382,000 tonnes in August—the weakest August level in six years—as record-high metal prices compress downstream fabricator margins, causing end-users to defer purchases and heightening downside risks from sluggish physical consumption.
- Macro Volatility and Energy Shock Escalation: Escalating Middle East geopolitical tensions pushing crude oil prices back above $100 per barrel have reignited global inflationary concerns. This macro risk-off environment increases mining and refining operating costs while threatening to trigger speculative profit-taking across industrial metals.
- Comex Stockpile Concentration and Tariff Unwind Risk: Aggressive pre-tariff positioning ahead of proposed U.S. import duties has pushed Comex warehouse stocks to a record above 695,000 tonnes. This massive inventory buffer leaves the futures market vulnerable to severe price drops if import tax implementation is delayed or if trade flows normalize.
- Technical Liquidity Stress and Position Unwinding: Following copper's rapid surge to consecutive record highs above $14,700 per tonne on the LME and $6.85 per pound on Comex, technical indicators show extended overbought conditions, increasing the likelihood of sharp intraday stop-loss liquidations and volatility.
Recommended Articles


