


EUR/USD Price Forecast: 1.1686-1.1710 zone remains key hurdle
- EUR/USD falls back to near 1.1625 as the US Dollar recovers.
- Investors keenly await the ECB’s policy meeting and the US CPI data for August.
- The ECB is expected to hike interest rates on Thursday.
The Euro (EUR) gives back its early gains and flattens at around 1.1625 against the US Dollar (USD) during the European trading session on Wednesday. The major currency pair falls back as the US Dollar recovers its early losses.
At press time, the US Dollar Index (DXY), which gauges the Greenback’s value against six major currencies, trades flat around 98.82.
Financial markets expect the outlook of the US Dollar banks upon the United States (US) Consumer Price Index (CPI) data for August, which will be released on Friday.
US inflation seen contained even as headline picks up on energy
According to TD Securities, the upcoming August CPI report should show that underlying price pressures remain contained, with the bank expecting that "underlying inflation stayed under control, with core likely rising 0.19% m/m (2.3% y/y)." Strategists there highlight that "the services segment should be the main driver, while core goods prices likely acted as a drag by posting a modest m/m drop." In contrast, they anticipate that "headline CPI will likely be a stronger 0.37% m/m (3.4% y/y) due to rising energy prices and a slight pickup in food inflation."
The inflation data is expected to have a significant impact on the Federal Reserve’s (Fed) monetary policy outlook.
Currently, the CME FedWatch tool shows a 60% chance that the Fed will raise interest rates in the September policy meeting.
Meanwhile, the Euro is expected to trade broadly sideways ahead of the European Central Bank (ECB) monetary policy announcement on Thursday. According to market expectations, the ECB will hike policy rates by 25 basis points (bps), which underscores commentary on interest rate expectations as a key trigger for the Euro’s next move.
Strategists at Scotiabank said in a note that “focus this week centres on Thursday’s ECB, where policymakers are widely expected to deliver a 25bps hike while maintaining a relatively hawkish tone as they seek to lean against the risk of energy-led inflation and mitigate any potential for broadening inflationary pressures.”
EUR/USD Technical Analysis
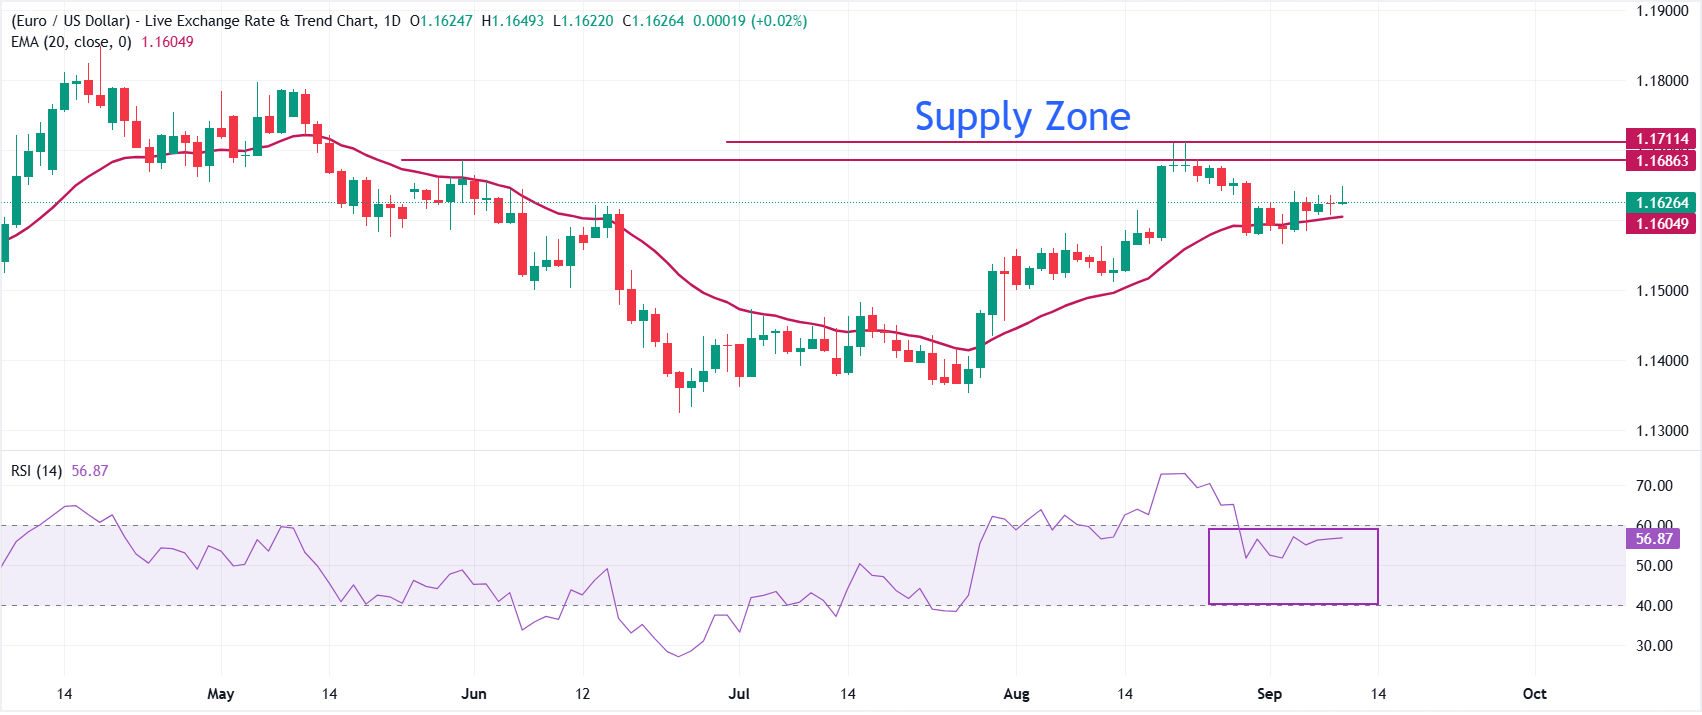
In the daily chart, EUR/USD trades at 1.1626. The pair holds a modest bullish bias as spot remains above the 20-day Exponential Moving Average (EMA) at 1.1605.
The Relative Strength Index (RSI) at roughly 57 stays in neutral-positive territory, hinting that upside momentum is present but not overstretched after the recent push higher.
On the downside, immediate support is located at the 20-day EMA around 1.1605, where a daily close below would weaken the constructive tone and expose a deeper correction toward prior lows; below that, the psychological level of 1.1500 is the key support level. On the upside, the 1.1686-1.1710 range is the critical supply zone for the pair.
(The technical analysis of this story was written with the help of an AI tool. Know more.)
Economic Indicator
ECB Main Refinancing Operations Rate
One of the three key interest rates set by the European Central Bank (ECB), the main refinancing operations rate is the interest rate the ECB charges to banks for one-week long loans. It is announced by the European Central Bank at its eight scheduled annual meetings. If the ECB expects inflation to rise, it will increase its interest rates to bring it back down to its 2% target. This tends to be bullish for the Euro (EUR), since it attracts more foreign capital inflows. Likewise, if the ECB sees inflation falling it may cut the main refinancing operations rate to encourage banks to borrow and lend more, in the hope of driving economic growth. This tends to weaken the Euro as it reduces its attractiveness as a place for investors to park capital.
Read more.Next release: Thu Sep 10, 2026 12:15
Frequency: Irregular
Consensus: 2.65%
Previous: 2.4%
Source: European Central Bank
Recommended Articles


