


Bitcoin signals early bull-market phase, $83K remains key confirmation level — CryptoQuant
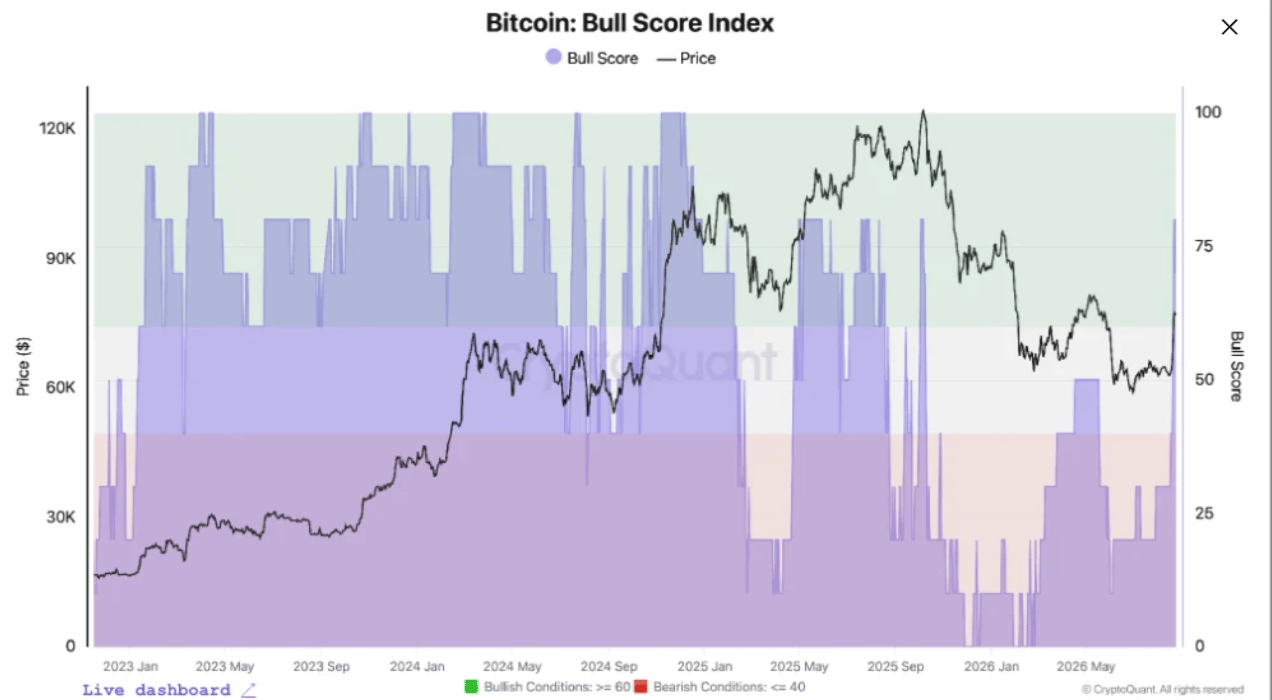
- Bitcoin’s Bull Score surged from 30 to 80 within a week, reaching its strongest reading since October 6.
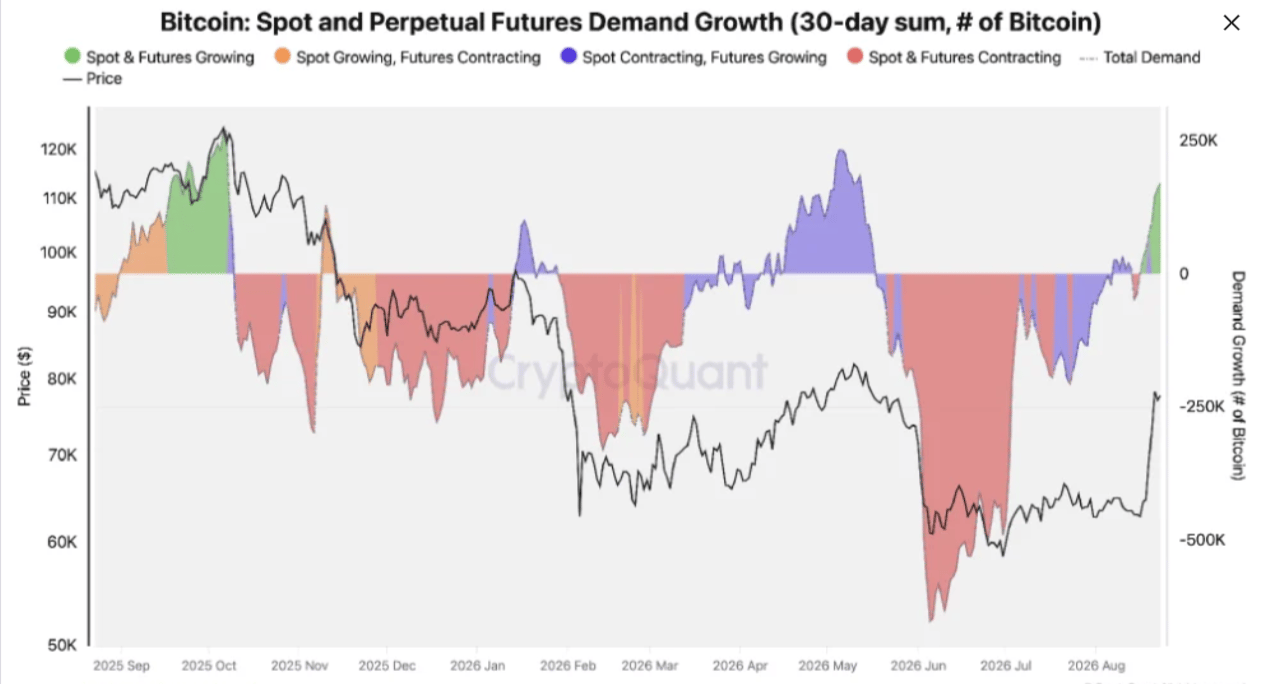
- Spot and futures demand are expanding together for the first time since early October, signaling stronger Bitcoin demand.
- BTC’s 365-day moving average stands at $83,000, with a decisive break above the level needed to confirm a new bull market.
Bitcoin has entered the initial phase of a potential new bull market after a 24% rally shifted the market into positive territory, according to a CryptoQuant report on Tuesday.
Bitcoin demand strengthens as spot and futures activity turn bullish
The rally improved Bitcoin’s valuation metrics, as CryptoQuant’s Bull Score jumped from 30 to 80 within a week, reaching its most bullish reading since October 6, when Bitcoin traded around $124,000.
CryptoQuant stated that stronger demand is supporting the latest rally, with apparent spot demand growing at its fastest monthly pace since late December.
More importantly, spot and futures demand are now expanding together for the first time since early October. The combination reflects genuine spot accumulation alongside a return of leveraged demand.
“Both apparent demand and the spot/futures decomposition turned decisively higher even before the announcements, the strongest demand configuration in nearly a year and a key pillar of the regime shift,” CryptoQuant wrote.
However, Bitcoin still faces a key price hurdle before confirming a new bull rally. BTC’s 365-day moving average currently sits at $83,000. The report noted that historical bull markets have officially begun when Bitcoin moves above this long-term average.
“A decisive break above $83K would confirm the new bull market; until then, that level is likely to act as an initial resistance,” CryptoQuant added.
Whale profits signal near-term selling pressure
Despite the bullish market structure, the report warned that Bitcoin appears overheated in the short term.
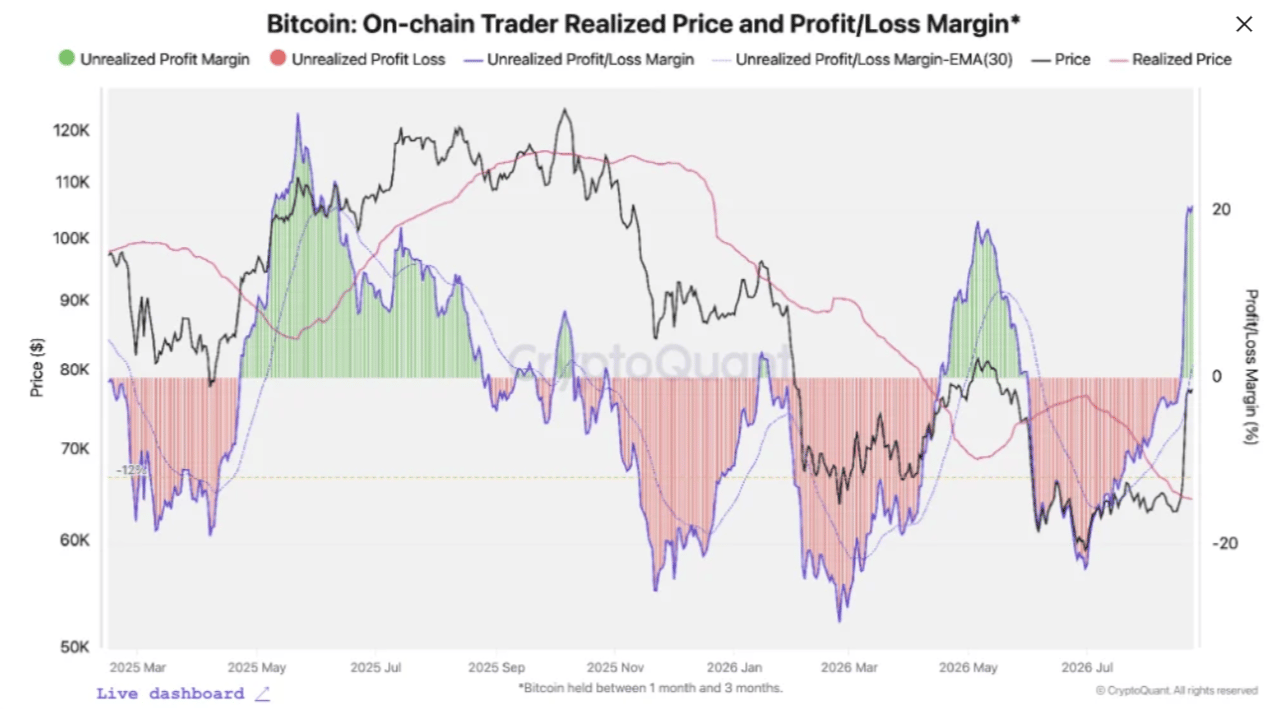
Trader unrealized profit margins have risen to 20.5%, the highest level since June 2025. Such elevated margins can encourage holders to lock in gains, potentially increasing selling pressure.
Whale profit-taking has also accelerated. Short-term-holder whales realized approximately $1.2 billion in profits between August 20 and 22. A record $614 million was realized in a single day on August 20 as Bitcoin traded around $78,000-$79,000.
CryptoQuant also identified rising exchange inflows as another potential source of near-term pressure. Bitcoin inflows reached approximately 53,000 BTC, the highest level since June 5. Ethereum (ETH) inflows climbed to roughly 1.7 million ETH, also the highest since that date.
“Exchange inflows capture supply moving toward the point of sale before that selling actually hits the market,” CryptoQuant stated.
The firm noted that transfers from self-custody to exchanges can signal an intention to distribute holdings, take profits or hedge positions.
XRP whale inflows also rose to approximately 460 million XRP, the highest level since February. Meanwhile, seven-day cumulative altcoin deposit transactions reached about 39,000, with most going to Binance.
“The regime has turned; the first leg may simply need to digest the rally first,” CryptoQuant added.
Bitcoin is changing hands at $78,890, down 2% over the past 24 hours at the time of writing.
Recommended Articles


