


Palladium (XPDUSD) Surges on Oct 8: What Lie behind the Move?
Palladium (XPDUSD) is up 2.05% at Oct 8 21:35(ET), now at $1141.66, with a 7-day down of 3.14%.
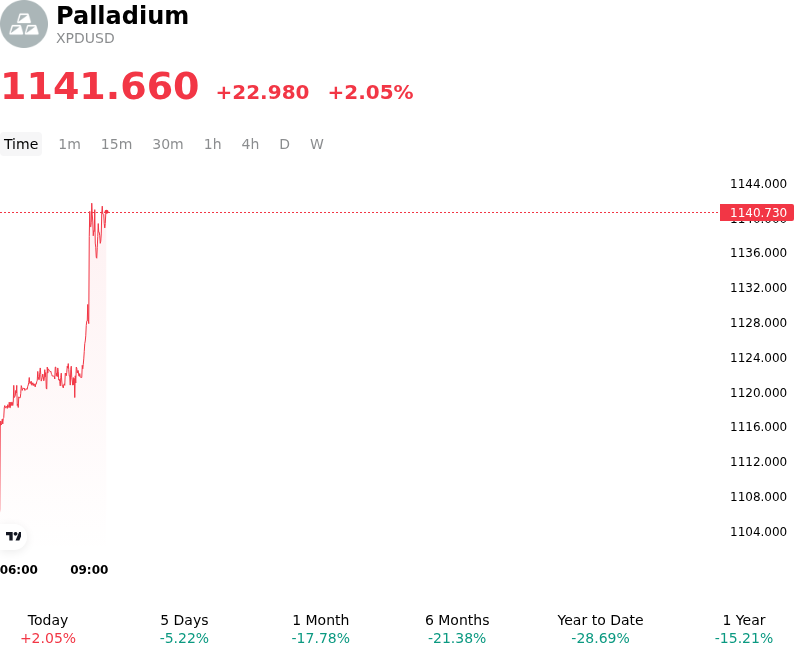
What is driving Palladium (XPDUSD)’s stock price up today?
The advance in spot palladium was primarily driven by a temporary easing of macroeconomic headwinds, accompanied by institutional short-covering following extended downside pressure. A retreat in global crude oil benchmark prices helped temper near-term inflation expectations, leading to a pullback in sovereign bond yields and a modest softening of the U.S. dollar index. This shift in financial conditions reduced the opportunity cost of holding non-yielding physical assets, providing a supportive backdrop across the precious and industrial metals complex.
From a positioning standpoint, palladium had been trading near the lower bound of its multi-month range due to persistent structural concerns regarding long-term automotive catalyst demand and accelerating electric vehicle adoption. The combination of oversold technical conditions and elevated speculative short exposure left the market highly sensitive to upside momentum, prompting systematic traders and institutional investors to cover short positions as broader macro pressure briefly subsided.
On the supply side, underlying operational constraints across primary producing regions provided fundamental support to the market floor. Mining operations in South Africa continue to navigate elevated operating costs and energy infrastructure instability, while ongoing labor friction and strike activity at select North American mining assets have constrained primary production growth. Furthermore, persistent geopolitical risks and potential trade frictions surrounding Russian output maintain a background risk premium, limiting downside elasticity when physical liquidity in major trading hubs is constrained.
While the broader fundamental outlook for palladium remains challenged by substitution toward alternative platinum-group metals and shifting automotive manufacturing trends, the upward price movement reflects a tactical repricing driven by favorable currency fluctuations, falling real yields, and technical short-squeezing across futures markets.
Technical Analysis of Palladium (XPDUSD)
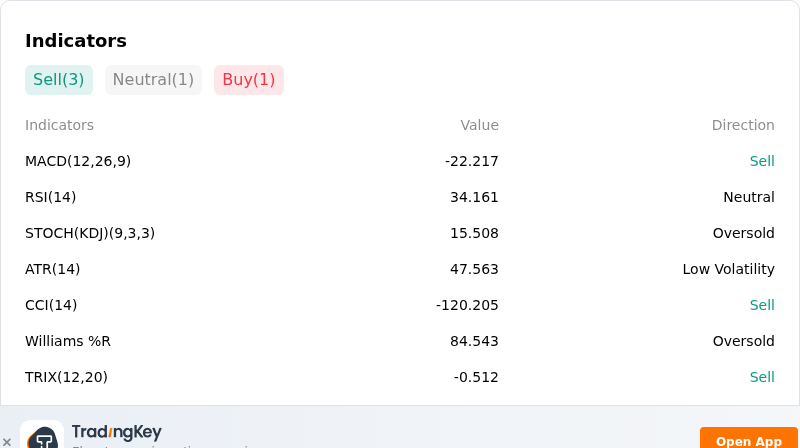
Technically, Palladium (XPDUSD) shows a MACD (12,26,9) value of -22.041, indicating a sell signal. The RSI at 34.433 suggests neutral condition and the Williams %R at 83.935 suggests oversold condition. Please monitor closely.
More details about Palladium (XPDUSD)
Recent Events and Risks:
- Structural Automotive Demand Deterioration: Accelerating global adoption of battery electric vehicles and slowing production of traditional gasoline-powered cars continue to reduce primary demand for catalytic converters, placing heavy downward pressure on spot palladium prices.
- Automaker Platinum Substitution and Secondary Scrap Growth: Ongoing technical substitution of lower-cost platinum for palladium in gasoline exhaust systems, combined with expanding secondary supply from PGM scrap recovery, reinforces market surplus forecasts and caps intraday price recoveries.
- Macro Drag from U.S. Dollar Strength and High Real Yields: Sustained strength in the U.S. dollar index and elevated Treasury yields increase the opportunity cost of holding non-yielding physical assets, driving systematic risk-off unwinds and institutional capital outflows.
- Futures Market Illiquidity and Positioning Liquidation: Thin trading liquidity and concentrated speculative short positioning in palladium futures exacerbate intraday price swings, exposing XPDUSD to sharp slippage and forced long liquidations during market downturns.
Recommended Articles


