


Ciena Corp Stock (CIEN) Moved Up by 11.02% on Oct 6: Drivers Behind the Movement
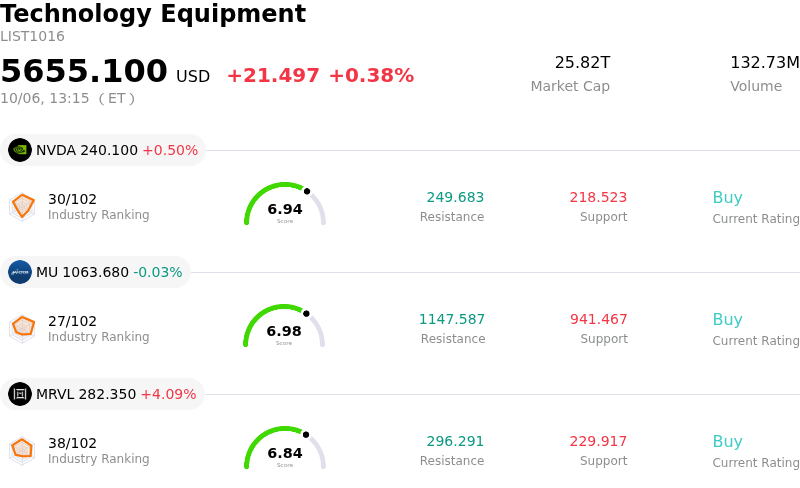
Ciena Corp (CIEN) moved up by 11.02%. The Technology Equipment sector is up by 0.38%. The company outperformed the industry. Top 3 stocks by turnover in the sector: NVIDIA Corp (NVDA) up 0.50%; Micron Technology Inc (MU) down 0.03%; Marvell Technology Inc (MRVL) up 4.04%.
What is driving Ciena Corp (CIEN)’s stock price up today?
Ciena experienced a sharp upward move driven by surging institutional appetite for AI optical networking infrastructure suppliers. As cloud hyperscalers accelerate data center expansion to support large language model training and inference, high-capacity optical transport systems have emerged as a vital architectural bottleneck. Ciena's latest financial trajectory demonstrates this structural tailwind, featuring substantial top-line revenue growth, record earnings per share, and an expanding order backlog extending deep into future fiscal years. The strong contribution from cloud provider clients underscores how hyperscaler capital spending is transitioning directly into high-margin optical platform sales.
Investor confidence was further amplified by management's aggressive long-term operational targets unveiled during its recent investor framework, alongside full-year guidance upward revisions. Wall Street analysts responded with a series of price target upgrades and rating revisions to Outperform, citing Ciena's technological lead with next-generation coherent optical solutions like WaveLogic platforms and its expanding total addressable market. Sell-side models highlight significant prospective earnings power and margin expansion through fiscal 2029, reinforcing sentiment that Ciena is positioned as a primary pure-play winner in the optical interconnect ecosystem.
From a market dynamics perspective, positive earnings estimate revisions and momentum buying triggered short covering and robust intraday buying. Despite high short-term valuation multiples relative to historical averages and potential risks associated with hyperscaler spending volatility or supply chain constraints, strong execution and elevated backlog visibility provide a solid fundamental floor. The current price action reflects market re-rating as institutional investors increasingly price in multi-year structural growth in AI bandwidth demand.
Technical Analysis of Ciena Corp (CIEN)
Technically, Ciena Corp (CIEN) shows a MACD (12,26,9) value of 18.982, indicating a neutral signal. The RSI at 67.906 suggests neutral condition and the Williams %R at 1.578 suggests overbought condition. Please monitor closely.
Fundamental Analysis of Ciena Corp (CIEN)
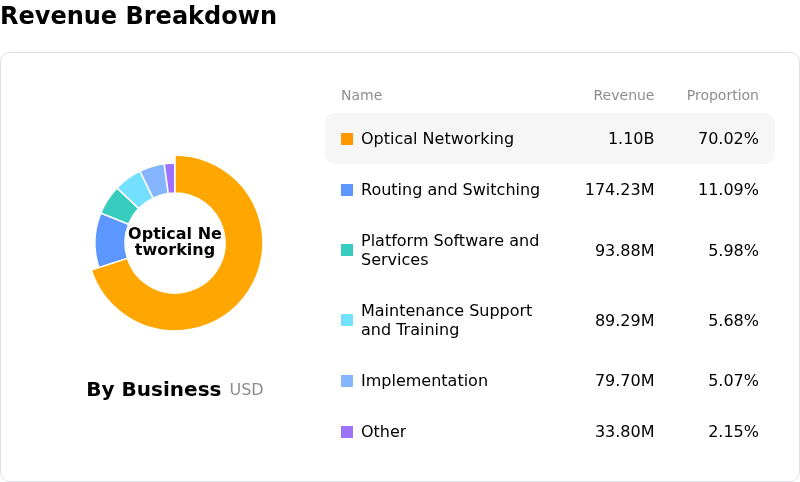
Ciena Corp (CIEN) is in the Technology Equipment industry. Its latest annual revenue is $4.77B, ranking 9 in the industry. The net profit is $123.34M, ranking 14 in the industry. Company Profile
Over the past month, multiple analysts have rated the company as Buy, with an average price target of $509.85, a high of $660.00, and a low of $323.44.
More details about Ciena Corp (CIEN)
Company Specific Risks:
- Persistent Component Supply Constraints: Ongoing supply chain bottlenecks for critical optical components continue to restrict Ciena's delivery capabilities, with management acknowledging supply-demand imbalances may stretch into 2028 and delay the conversion of its order backlog into recognized near-term revenue.
- Gross Margin Guidance Compression: Institutional analysts have highlighted Ciena’s capped gross margin outlook of 45% to 46% as a major financial overhang, which limits earnings expansion and restricts operating leverage.
- Vulnerability to Valuation Multiple Compression: Trading at a steep valuation multiple near 79x trailing earnings relative to communications equipment peers, Ciena faces heightened intraday price volatility whenever industry-wide AI infrastructure multiple compression occurs.
- Hyperscaler Order Timing and Execution Risk: Near-term performance is heavily dependent on major cloud hyperscalers for optical interconnect deployment, exposing the company to downside risk if customer cluster buildout schedules slip into late 2027 or beyond.
Recommended Articles


